Please refer to Class 11 Economics Sample Paper Term 1 With Solutions Set B provided below. The Sample Papers for Class 11 Economics have been prepared based on the latest pattern issued by CBSE. Students should practice these guess papers for class 11 Economics to gain more practice and get better marks in examinations. The Term 1 Sample Papers for Economics Standard 11 will help you to understand the type of questions which can be asked in upcoming examinations.
Term 1 Sample Paper for Class 11 Economics With Solutions Set B
Question. All the measures are equal to each other in case of ……… .
(a) symmetrical distribution
(b) asymmetrical distribution
(c) continuous frequency distribution
(d) cumulative frequency distribution
Answer
A
Question. Which of the following method of presentation of data have a long lasting impact on mind of people who are reading the data?
(a) Tabular presentation
(b) Diagrammatic presentation
(c) Graphical presentation
(d) Both (b) and (c)
Answer
D
Question. Arithmetic mean is the only measure of central tendency which cannot be calculated using the empirical relationship. Choose from the options below.
(a) True
(b) False
(c) Partially true
(d) Incomplete statement
Answer
B
Question. You are given with a statistical information related to production of face mask across different parts of the country during the pandemic time. The above case refers to which type of classification of data?
(a) Spatial classification
(b) Temporal classification
(c) Chronological classification
(d) None of the above
Answer
A
Question. As per the property of arithmetic mean, it is ……… of change in origin.
(a) dependent
(b) independent
(c) affected
(d) None of these
Answer
B
Question. According to Prof. Adam Smith, the subject matter of economics is restricted to study of human behaviour. Choose from the options below.
(a) True
(b) False
(c) Partially true
(d) Incomplete statement
Answer
B
Question. Tabulation is the process of presenting statistical information with heterogeneous characteristics in the same group. Choose from the options below.
(a) True
(b) False
(c) Partially true
(d) Incomplete statement
Answer
B
(a) Both Assertion (A) and Reason (R) are true and Reason (R) is the correct explanation of Assertion (A)
(b) Both Assertion (A) and Reason (R) are true, but Reason (R) is not the correct explanation of Assertion (A)
(c) Assertion (A) is false, but Reason (R) is true
(d) Both are false
Question. Assertion (A) Any individual quantitative information do not contribute to a statistical enquiry.
Reason (R) Statistics is aggregate of facts which includes quantitative information placed in groups according
to common attributes.
Answer
A
Question. Assertion (A) Bi-variate frequency distributions can be used to present more than two attributes of a statistical enquiry.
Reason (R) The statistical data arranged based upon the homogeneous attributes are capable of further statistical analysis.
Answer
C
Question. Which of the following measures should be used to analyse higher quarter of the data arranged in increasing order?
(a) Median
(b) Lower quartile
(c) Upper quartile
(d) Both (b) and (c)
Answer
C
Question. Which of the following is not a method of statistical enquiry?
(a) Collecting of primary data
(b) Organisation of data
(c) Analysis of statistical data
(d) Summarising the statistical data
Answer
D
Question. Mode is the most ill-defined measure of central tendency as compared to arithmetic mean and median. Choose from the options below.
(a) True
(b) False
(c) Partially true
(d) Incomplete statement
Answer
A
Question. An act of earning livelihood by doing some productive work is known as a ……… .
(a) Market economic activity
(b) Non-market economic activity
(c) Non-economic activity
(d) Either (a) or (b)
Answer
D
Direction Analyse the following case study graphs and answer questions


Question. Mode value of a given series can be located using ……… .
(a) Histogram only
(b) Bar graphs only
(c) Both (a) and (b)
(d) Neither (a) nor (b)
Answer
A
Question. As per figure-1, mode value will lie in which of the following range?
(a) 80-90
(b) 90-100
(c) 100-110
(d) Can’t be calculated
Answer
D
Question. Median cannot be located graphically using figure-1 alone. Choose from the options below.
(a) True
(b) False
(c) Partially true
(d) Incomplete statement
Answer
A
Question. Which of the following flavours of ice-cream represent the mode value in figure-2?
(a) Peach
(b) Strawberry
(c) Vanilla
(d) Chocolate
Answer
D
Question. As per figure-1, arithmetic mean value will lie in which of the following range?
(a) 80-90
(b) 90-100
(c) 100-110
(d) Can’t be calculatedwith the help of given data
Answer
D
Question. At all points on an indifference curve, a consumer gets ……… level of satisfaction.
(a) same
(b) increasing
(c) decreasing
(d) All of the above
Answer
A
Question. Elasticity of demand for comfort goods are ……… .
(a) highly elastic
(b) moderately elastic
(c) inelastic
(d) highly inelastic
Answer
B
Question. Demand curve of a giffen good is upward sloping. Choose from the options below.
(a) True
(b) False
(c) Partially true
(d) Incomplete statement
Answer
A
Question. The demand of sanitizers suddenly increase during the covid-19 pandemic. Study of this market comes under the scope of study of which of the following branches of Economics?
(a) Microeconomics
(b) Macroeconomics
(c) Both (a) and (b)
(d) Neither (a) nor (b)
Answer
A
Question. Which of the following goods follows law of demand?
(a) Normal goods
(b) Inferior goods (which are not giffen)
(c) Both (a) and (b)
(d) Neither (a) nor (b)
Answer
B
Question. In which of the following case, demand curve for a normal good will not shift from its original position?
(a) Increase in income of the consumer
(b) Increase in the price of good concerned
(c) Decrease in the price of its complementary goods
(d) None of the above
Answer
B
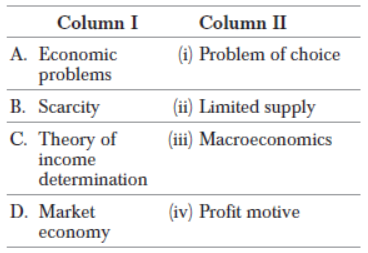
Question. Choose the incorrect pair from given below.

Codes
(a) A – (i)
(b) B – (ii)
(c) C – (iii)
(d) D – (iv)
Answer
C
Question. Choose the correct pair from given below.

Codes
(a) A – (i)
(b) B – (ii)
(c) C – (iv)
(d) All of the above pairs are incorrect
Answer
D
Question. Normative statements can never be converted in positive economics under any circumstance. Choose from the options below.
(a) True
(b) False
(c) Partially true
(d) Incomplete statement
Answer
B
(a) Both Assertion (A) and Reason (R) are true and Reason (R) is the correct explanation of Assertion (A)
(b) Both Assertion (A) and Reason (R) are true, but Reason (R) is not the correct explanation of Assertion (A)
(c) Assertion (A) is false, but Reason (R) is true
(d) Both are false
Question. Assertion (A) When more of a good is demanded at the same price, Law of DMU does not hold true for that good.
Reason (R) Law of DMU has universal acceptability with few assumptions, postponements and exceptions.
Answer
A
Question. Assertion (A) Elasticity of demand plays a vital role in deciding the shape of demand curve for a normal good.
Reason (R) Demand curve for a luxury good is flatter as compared to the demand curve of a normal good.
Answer
B
Question. Assertion (A) Verification of any given statement is possible only in case of normative sciences.
Reason (R) Economist uses various statements to represent different economic situations either based upon judgement or facts.
Answer
C
Question. Assertion (A) Total expenditure remains high on the commodity with low price elasticity of demand.
Reason (R) Consumption of tobacco products including cigarettes have inelastic demand as compared to non-tobacco products.
Alternatives
(a) Both Assertion (A) and Reason (R) are true and Reason (R) is the correct explanation of Assertion (A)
(b) Both Assertion (a) and Reason (R) are true, but Reason (R) is not the correct explanation of Assertion (A)
(c) Assertion (A) is false, but Reason (R) is true
(d) Both are false
Answer
A
Case Based
The research of Vietnam Public Health University shows that each year, smoking kills 40,000 Vietnamese, four times the fatalities from traffic accidents. Total expenditures of treating three common diseases involving smoking include lung cancer, chronic obstructive pulmonary disease and ischemia heart disease comes to 1,100 billion VND/year. According to Mrs. Hoang Anh from Health Bridge Organisation in Hanoi, at the same brand of cigarette, a pack of it in Vietnam has the cheapest price. The average retail price of cigarettes is 0.22 USD/pack – a price that almost cannot be found anywhere in the world. Thus, the youth is easier to approach smoking since cigarettes are too cheap and too simple to buy. In fact, as the statistics of SAVY (Survey Assessment of Vietnamese Youth) in 2003 – 2004, in the age of 14 – 25, 43.6 per cent smoker is male and 1.2 per cent is female, the rate of smokers increase with age. 71.7 per cent male smoker continues smoking. Mrs. Hoang Anh said the reason of low-cost cigarette is because in Vietnam, the tax imposed on cigarettes are among the lowest. Recently, the WHO has recommended the cigarette tax should be at 65 per cent/retail costs, however, Vietnam has just reached 46 per cent. The price elasticity concepts can be used in this case in an effort to deter people from smoking. Tobacco products are kind of goods with inelastic demand since there is almost no substitute goods for them. Therefore, it is hard to reduce the amount of people smoking once they have been addicted. Moreover, cigarettes also have a high-income elasticity of demand as people with high income will be willing to buy a lot more of packs of cigarettes, thus, they become more and more addicted.
Question. Demand of cigarettes among youth in the above case is ……… .
(a) elastic
(b) inelastic
(c) perfectly elastic
(d) perfectly inelastic
Answer
B
Question. What will be the demand curve of perfectly inelastic demand curve?
(a) Horizontal line parallel to X-axis
(b) Vertical line parallel to Y-axis
(c) Straight line passing through origin
(d) Rectangular hyperbola
Answer
B
Question. Impact on demand for tobacco product is found to be ………… in teenagers.
(a) elastic
(b) inelastic
(c) perfectly inelastic
(d) perfectly elastic
Answer
A
Question. In Indian markets, it has been observed that in spite of increased taxes demand for tobacco products remained high.
Choose the most appropriate reason from the given below points.
(a) Strong taste and preferences
(b) Unawareness about the ill effects
(c) No proper implication of policies
(d) All of the above
Answer
D
Case Based
Direction Analyse the following case study table and graph and answer questions Given below are the two different forms of presentation of data Source : Author’s field work, 2015 Trend Analysis—Graphical Representation Amount of Sales per month per country


Question. The division based upon the gender in the above table is ……… .
(a) stub
(b) caption
(c) body of the table
(d) None of these
Answer
A
Question. In the above table, which of the following unit of measurement is used to present the information?
(a) Absolute number
(b) Proportionate number
(c) Percentage number
(d) None of the above
Answer
C
Question. Which of the following components is missing from the table given above?
(a) Title of the table
(b) Stubs
(c) Captions
(d) Source
Answer
A
Question. ……… are used to present more than one related components together in a graphical form.
(a) Simple horizontal bar graphs
(b) Simple vertical bar graphs
(c) Multiple bar graphs
(d) None of the above
Answer
C
Question. The information presented using the graphical mode represents deviation bar graph. Choose from the options below.
(a) True
(b) False
(c) Partially true
(d) Incomplete statement
Answer
B


