Please refer to Introduction Class 11 Statistics notes and questions with solutions below. These Class 11 Statistics revision notes and important examination questions have been prepared based on the latest Statistics books for Class 11. You can go through the questions and solutions below which will help you to get better marks in your examinations.
Class 11 Statistics Introduction Notes and Questions
1. CONCEPT OF ECONOMICS
We advise the young learners of Class XI to comprehend the concept of economics through the following discussion relating to ordinary (or routine) business (or activities) of our life.
Every individual, ranging from a child to an old man, is engaged in some economic activity or the other. Consumption is an important economic activity; and we all are consumers, consuming different goods and services for the satisfaction of our wants.
Who is a Consumer?
A consumer is one who consumes goods and services for the satisfaction of his wants.
What is Consumption?
Consumption is the process of using up utility value of goods and services for the direct satisfaction of our wants. Utility value of goods means inherent capacity of goods and services to satisfy human wants.
Production is another economic activity, and many of us are producers, engaged in the production of different goods and services for the generation of income.
Who is a Producer?
A producer is one who produces and/or sells goods and services for the generation of income.
What is Production?
Production is the process of converting raw material into useful things. Things become useful as they acquire utility value in the process of production.
Saving and investment are also economic activities, and many of us are savers and investors. We save a part of our income for future consumption or for investment in shares and bonds to generate income.
What is Saving?
It is that part of income which is not consumed. It is an act of abstinence from consumption.
What is Investment?
It is expenditure by the producers on the purchase of such assets which help to generate income.
Thus, we are consumers, producers, savers and investors. We are all engaged in diverse economic activities. Economic activities include consumption, production, saving,
investment, and many more.
What is Economic Activity?
It is an activity which is related to the use of scarce means (also called scarce resources).
Means are always scarce in relation to our wants. Imagine yourself as the richest person on the earth. Still you can’t have everything you wish to have at a point of time. It implies the scarcity of your means/ resources in relation to your wants.
Engaged in diverse economic activities, we are performing ‘ordinary business of life’, according to Alfred Marshall, a great pro founder of Modern Economics. Thus, he defines economics as “the study of mankind in the ordinary business of life.”
Scarcity is the Undercurrent of Economic Problem and therefore of Economics
Resources are always scarce in relation to our wants. Also, resources have alternative uses: A ten-rupee note in your pocket may be spent on a cup of coffee or a cold drink. Likewise, a worker may render his services in factory A, rather than B and C. Because, resources are scarce and have alternative uses, we cannot escape from the problem of allocation of limited means to alternative uses. This is what we call economic problem or the problem of choice.
What is Economic Problem?
It is the problem of choice (or the problem of allocating scarce resources to alternative uses) arising on account of the fact that resources are scarce and these have alternative uses.
Economics is essentially the study of economic problems that we must confront owing to the fact that our means are scarce in relation to our wants, and that the means have alternative uses. If there is no scarcity, there is no economic problem, and there is no economics if there is no economic problem. Thus, Robbins defines economics as “A science that studies human behaviour as a relationship between ends and scarce means which have alternative uses.”
Three Distinct Components of Economics: Consumption, Production and Distribution Consumption
Here, we, as students of economics, study behaviour of human beings as consumers or buyers of different goods and services for the satisfaction of their wants. As consumers, people have limited means, while their wants are unlimited. How do they allocate their given means (or income) to the purchase of different goods and services, (given their market prices) so that their satisfaction is maximised? This is the study of consumption or the study of consumer behaviour. When we formulate a set of standard relationships (like the inverse elationship between price of good and its purchase) explaining how consumers tend to behave, we call it consumption theory.
Production
Producers also have limited means while they have a wide range of goods and services to choose from for their firms and factories. Given prices of different inputs, how do they choose such combination(s) which are least expensive, so that they are able to minimise their cost of production. Also, given prices of different goods, how do they choose to produce those, the production of which offers them maximum revenue, so that their profit (profit = revenue – costs) is maximised. This is the study of production, or the study of producers’ behaviour. When we formulate a set of standard relationships (like greater the productivity of a factor, greater is its employment) explaining the behaviour of producers or their production decisions, we call it production theory.
Distribution
As students of economies we are also interested in knowing how income (generated in the process of production) is distributed among those who have worked as agents of production. Who are agents of production? These are owners of factors of production, viz. land, labour, capital and entrepreneurship. A part of income generated will go to the owners of land (used in production) in the form of rent; a part will go to labourers (for rendering their services) in the form of wage; a part will go to the owners of capital (used in production) in the form of interest; and a part will go to the entrepreneurs in the form of profits. Distribution of income refers to the distribution of GDP (gross domestic product) among the owners of the factors of production (land, labour, capital and entrepreneurship). What are the economic principles on the basis of which income is distributed among owners of the factors of production? Such a study is called distribution theory in economics.
Besides these three major components of economics, the economists also address such questions which are of social significance, like the question of poverty and unemployment, the question of growth with social justice and the question of environmental degradation as linked to various economic activities. Issues of social significance or collective significance are categorised as issues of macroeconomics. These are distinct from the issues of microeconomics which revolve around the problems of choice confronted by microeconomic units like a household, a firm or an industry.
Microeconomics and Macroeconomics
Microeconomics deals with economic issues or economic problems related to microeconomic units like a household, a firm or an industry. These issues and problems are studied and addressed largely with a view to maximising individual welfare. Macroeconomics deals with economic issues or economic problems at the level of economy as a whole. These issues or problems are studied and addressed keeping in mind the goals of social welfare or collective welfare.
2. WHAT IS STATISTICS?
Even to a layman this should not be a difficult question. If asked to define Statistics, we can expect a layman to say that Statistics is something like a store of quantitative information. Yes, it is true. Statistics means quantitative information or quantification of the facts and findings. But, how do we get quantitative information? There must be a system, method or technique to collect quantitative information. Also, statistical information may be a raw information. It needs to be classified, tabulated or it needs to be systematically presented. One must learn the system of presentation and classification of data. Also, there must be a set of methods and techniques to condense the data. May be, we find averages or percentages. And above all, there must be a set of methods or techniques on the analysis and interpretation of quantitative information. A student of economics has to study all these methods and techniques to understand and master the subject matter of Statistics.
Thus, unlike a layman, a student of economics cannot relax taking Statistics just as a pool of quantitative information. Instead he is also to look into the methods or techniques relating to its collection, classification, presentation, analysis as well as interpretation.
In view of such a vastness of the subject matter, Statistics is defined both in singular sense and plural sense, as under:
Statistics—A Plural Noun
In its plural sense, Statistics refers to information in terms of numbers or numerical data, such as Population Statistics, Employment Statistics, Statistics concerning Public Expenditure, etc. However, any numerical information is not Statistics. Example: Ram gets Rs. 100 per month as pocket allowance is not Statistics (it is neither an aggregate nor an average) whereas average pocket allowance of the students of Class X is Rs. 100 per month, or there are 80 students in Class XI compared to just 8 in Class XII of your school are Statistics.
The following table shows a set of data which is Statistics, and another set which is not Statistics. The figures used are hypothetical.

Distinction between Quantitative and Qualitative Data
This is related to the distinction between quantitative variables and qualitative attributes. There are quantitative variables like income, expenditure and investment which can be expressed in numerical terms, viz., per capita income in India was (say) Rs. 40,000 per month, per capita expenditure was (say) Rs. 30,000 per month, and net investment (or capita formation) was (say) Rs. 10,000 crore in the year 2017-18. All such data are called quantitative data. On the other hand, there are qualitative attributes like ‘IQ’ level of different individuals or beauty of the individuals which cannot be expressed in numerical terms.
These attributes refer to qualitative characteristics of the objects. These can be ranked or rated as good, very good, or excellent. We may give them ranks as 1, 2, 3, etc. All such data are called qualitative data. Briefly, while quantitative data refers to quantitative variables, qualitative data refers to qualitative attributes of the different objects.
Thus:
All Statistics are data, but all data are not Statistics.
Definition
In its plural sense, this is how Statistics is defined by different authors:
“Statistics are numerical statements of facts in any department of enquiry placed in relation to each other. ” —Bowley
“By Statistics we mean quantitative data affected to a marked extent by multiplicity of causes. ” —Yule and Kendall
Features or Characteristics of Statistics in the Plural Sense or as Numerical Data
Main characteristics of Statistics in terms of numerical data are as follows:
(1) Aggregate of Facts: A single number does not constitute Statistics. No conclusion can be drawn from it. It is only the aggregate number of facts that is called Statistics, as the same can be compared and conclusions can be drawn from them. For example, if it is stated that there are 1,000 students in our college, then it has no statistical significance. But if it is stated that there are 300 students in arts faculty, 400 in commerce faculty and 300 in science faculty in our college, it makes statistical sense as this data conveys statistical information. Similarly, if it is stated that population of India is 121 crore or that the value of total exports from India is Rs. 14,41,420 crore, then these aggregate of facts will be termed as Statistics. It can, therefore, be concluded ‘All Statistics are expressed in numbers but all numbers are not Statistics’.
(2) Numerically Expressed: Statistics are expressed in terms of numbers. Qualitative aspects like ‘small’ or ‘big’; ‘rich’ or ‘poor’; etc. are not called Statistics. For instance, to say, Irfan Pathan is tall and Sachin is short, has no statistical sense. However, if it is stated that height of Irfan Pathan is 6 ft and 2-inches and that of Sachin is 5 ft and 4-inches, then these numericals will he called Statistics.
(3) Multiplicity of Causes: Statistics are not affected by any single factor; but are influenced by many factors. Had they been affected by one factor alone then by removing that factor they would lose all their significance. For instance, 30 per cent rise in prices may have been due to several causes, like reduction in supply, increase in demand, shortage of power, rise in wages, rise in taxes, etc.
(4) Reasonable Accuracy: A reasonable degree of accuracy must be kept in view while collecting statistical data. This accuracy depends on the purpose of investigation, its nature, size and available resources.
(5) Mutually related and Comparable: Such numericals alone will be called Statistics as are mutually related and comparable. Unless they have the quality of comparison they cannot be called Statistics.
For example, if it is stated “Ram is 40 years old, Mohan is 5 ft tall, Sohan has 60 kg of weight”, then these numbers will not be called Statistics, as they are not mutually related nor subject to comparison. However, if the age, height and weight of all the three are inter-related, then the same will be considered as Statistics.
(6) Pre-determined Objective: Statistics are collected with some pre-determined objective. Any information collected without any definite objective will only be a numerical value and not Statistics. If data pertaining to the farmers of a village is collected, there must be some pre-determined objective. Whether the Statistics are collected for the purpose of knowing their economic position, or distribution of land among them or their total population, or for any other purpose, all these objectives must be pre-determined.
(7) Enumerated or Estimated: Statistics may be collected by enumeration or are estimated. If the field of investigation is vast, the procedure of estimation may be helpful. For example, 1 lakh people attended the rally addressed by the Prime Minister in Delhi and 2 lakh in Mumbai. These Statistics are based on estimation. As against it, if the field of enquiry is limited, the enumeration method is appropriate. For example, it can be verified by enumeration whether 20 students are present in the class or 10 workers are working in the factory.
(8) Collected in a Systematic Manner: Statistics should be collected in a systematic manner. Before collecting them, a plan must be prepared. No conclusion can be drawn from Statistics collected in haphazard manner. For instance, data regarding the marks secured by the students of a college without any reference to the class, subject, examination or maximum marks, etc., will lead to no conclusion. In short, it can safely be concluded that “all numerical data cannot be called Statistics but all Statistics are called numerical data. ”
Statistics-A Singular Noun
In the singular sense, Statistics means science of Statistics or statistical methods. It refers to techniques or methods relating to collection, classification, presentation, analysis and interpretation of quantitative data.
Focus of the Study
Statistics as a singular noun is focus of the study for the students of Class XI. You are to learn and understand how to collect data, organise data, present data as well as analyse and interpret data.
Definition
“Statistics may be defined as the collection, presentation, analysis and interpretation of numerical data. ” —Croxton and Cowden
“Statistics is the science which deals with the collection, classification and tabulation of numerical facts as a basis for the explanation, description and comparison of phenomena. ” —Lovitt “
Statistics is the science which deals with the methods of collecting, classifying, presenting, comparing and. interpreting numerical data, collected to th row some light on any sphere of enquiry. ” —Seligman
Stages of Statistical
Study Studying Statistics as a singular noun implies the knowledge of various stages of statistical study. These stages are:

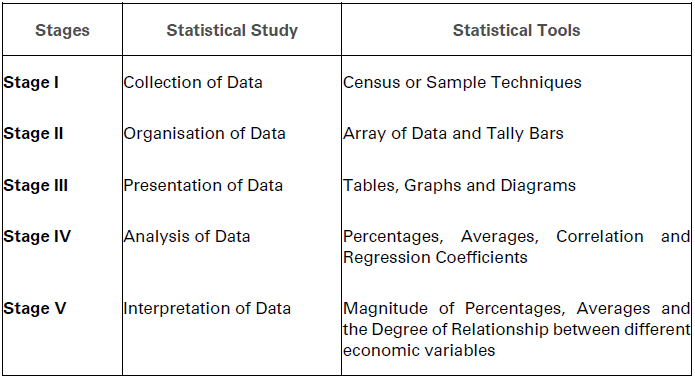
Obviously, at the first stage, we collect statistical data. Second, we organise the data in some systematic order. Third, we present the data in the form of graphs, diagrams or tables. Fourth, we analyse the data in terms of averages or percentages. Fifth, and finally, we interpret the data to find certain conclusions.
Statistical Tools
Each stage of the statistical study involves the use of certain standard techniques or methods. These techniques or methods are called statistical tools. Thus, there are statistical tools used for the collection of data, like the ‘Sample’ and ‘Census’ techniques. Array of data and tally bars are the standard techniques used for organisation of data. Tables, graphs and diagrams are the well-known statistical tools for the presentation of data.
Averages and percentages are the commonly used techniques for the analysis of data. Interpretation of data is often done in terms of the magnitude of averages, percentages or coefficients of correlation/regression. The following table gives an overall view of the various stages of statistical study and the related sets of statistical tools.
What are Statistical Tools? These refer to the methods or techniques used for the collection, organisation and presentation of data, as well as for the analysis and interpretation of data.
Stages of Statistical Study and the Related Statistical Tools
3. SCOPE OF STATISTICS
Study of the scope of statistics includes:
(1) Nature of Statistics,
(2) Subject Matter of Statistics, and
(3) Limitations of Statistics.
Nature of Statistics
Here, the basic question is whether Statistics is a science or an art. Prof. Tippet, has rightly observed that “Statistics is both a science as well as an art.” As a science, Statistics studies numerical data in a scientific or systematic manner. As an art, Statistics relates to quantitative data to the real life problems. By using statistical data, we are able to analyse and understand real life problems much better than otherwise. Thus, the problem of unemployment in India is more meaningfully analysed when the size of unemployment is supported with quantitative data.
Subject Matter of Statistics
Subject matter of statistics includes two components: Descriptive Statistics and Inferential Statistics.


The Concept of Universe or Population
It should be interesting for the students of Clsss XI to note that the concept of universe or population has a specific meaning in Statistics. It refers to the aggregate of all items or units relating to your statistical study. Example:
Universe or population size is 1,000 if you are studying 1,000 students for your statistical study.
(1) Descriptive Statistics: Descriptive Statistics refers to those methods which are used for the collection, presentation as well as analysis of data. These methods relate to such estimations as ‘measurement of central tendencies’ (average mean, median, mode), ‘measurement of dispersion’ (mean deviation, standard deviation, etc.), ‘measurement of correlation’, etc. Example: Descriptive statistics is used when you estimate average height of the secondary students in your school. Likewise, descriptive statistics is used when you find that marks in science and mathematics of the students in all classes are intimately related to each other.
(2) Inferential Statistics: Inferential Statistics refers to all such methods by which conclusions are drawn relating to the universe or population on the basis of a given sample. (In Statistics, the term universe or population refers to the aggregate of all items or units relating to any subject.) For example, if your class teacher estimates average weight of the entire class (called universe or population) on the basis of average weight of only a sample of students of the class, he is using inferential statistics.
Limitations of Statistics
In modern times. Statistics has emerged to be of crucial significance in all walks of life. However, it has certain limitations. Thus, writes Newshome that, “Statistics must be regarded as an instrument of research of great value but barring severe limitations which are not possible to overcome.” Following are some notable limitations of Statistics:
(1) Study of Numerical Facts only: Statistics studies only such facts as can be expressed in numerical terms, it does not study qualitative phenomena like honesty, friendship, wisdom, health, patriotism, justice, etc.
(2) Study of Aggregates only: Statistics studies only the aggregates of quantitative facts. It does not study statistical facts relating to any particular unit. Example: It may be a statistical fact that your class teacher earns Rs. 50,000 per month. But, as this fact relates to an individual, it is not to be deemed as a subject matter of Statistics. However, it becomes a subject matter of Statistics if we study income of school teachers across all parts of the country, for purpose of finding regional differences in income.
(3) Homogeneity of Data, an essential Requirement: To compare data, it is essential that statistics are uniform in quality. Data of diverse qualities and kinds cannot be compared. For example, production of food grains cannot be compared with the production of cloth. It is because cloth is measured in meters and food grains in tonnes. Nevertheless, it is possible to compare their value instead of the volume.
(4) Results are True only on an Average: Most statistical findings are true only as averages. They express only the broad tendencies. Unlike the laws of natural sciences, statistical observations are not error-free. They are not always valid under all conditions. For instance, if it is said that per capita income in India is Rs. 50,000 per annum, it does not mean that the income of each and every Indian is Rs. 50,000 per annum. Some may have more and some may have less,
(5) Without Reference, Results may Prove to be Wrong: In order to understand the conclusions precisely, it is necessary that the circumstances and conditions under which these conclusions have been drawn are also studied. Otherwise, they may prove to be wrong.
(6) Can be used only by the Experts: Statistics can be used only by those persons who have special knowledge of statistical methods. Those who are ignorant about these methods cannot make sensible use of statistics. It can, therefore, be said that data in the hands of an unqualified person is like a medicine in the hands of a quack who may abuse it, leading to disastrous consequences. In the words of Yule and Kendall, “Statistical methods are most dangerous tools in the hands of an inexpert.”
(7) Prone to Misuse: Misuse of Statistics is very common. Statistics may used to support a pre-drawn conclusion even when it is absolutely false. It is usually said, “Statistics are like clay by which you can make a god or a devil, as you please.” Misuse of statistics is indeed its greatest limitation.
4. FUNCTIONS AND IMPORTANCE OF STATISTICS IN ECONOMICS
Following words of Prof. Tippet very aptly capture the importance of Statistics in economics: “A day might come when the department of economics in the universities will go out of the control of economic theoreticians and come under the control of statistical workshops, in the same manner as the department of physics and chemistry have come under the control of experimental laboratories.” Indeed, Statistics has emerged as the lifeline of economics. It is because of the growing use of Statistics by the economists that the subjects like econometrics have been added to the horizons of economics. Students of Class XI may note the following points to highlight the significance (functions and importance) of Statistics in economics.
(1) Quantitative Expression of Economic Problems:
Consider any economic problem, be it the problem of unemployment, the problem of price rise or the problem of shrinking exports. The first task of the economists is to understand its magnitude through its quantitative expression.
For example, if it is the problem of unemployment, we make its quantitative expression stating that (say) 20 per cent of the India’s working population is unemployed or that between the years 1995-2010 the percentage of unemployed working population has tended to increase from 18 per cent to 9.4 per cent.
(2) Inter-sectoral and Inter-temporal Comparisons: Economists do not stop merely at the quantitative expression of the problems. They would try to further comprehend it through inter-sectoral and inter-temporal comparisons. From inter-sectoral comparisons we mean, comparisons across different sectors of the economy. Thus, analysing the problem of unemployment, the economists would like to know the magnitude of unemployment across rural and urban sectors of the economy. They would like to know what percentage of rural population is unemployed compared to the urban population. Inter-temporal comparison means understanding of change in the magnitude of the problem over time. This would mean making a comparison (say) over different plan periods of the rural and urban unemployment.
(3) Working out Cause and Effect Relationship:
Economists try to find out cause and effect relationship between different sets of data. This enables them to attempt an effective diagnosis of the problem and accordingly to suggest some effective remedies. Thus, through their statistical studies, if the economists come to know that it is because of the decline in demand that investment in the economy has tended to shrink, they can suggest the government to adopt such measures as would increase the level of demand in the economy.
Two Important points on the Significance of Statistics in Economics
(i) Statistics facilitates inter-sectoral and inter-temporal comparison.
(ii) Statistics helps to establish cause and effect relationship between different economic variables that have facilitated the construction of economic theories.
(4) Construction of Economic Theories or Economic Models: What is economic theory? It is an established statistical relationship between different sets of statistical data, offering conclusions of economic significance. The well-known inverse relationship between price of a commodity and its demand (i.e., more is purchased when price falls) is an established statistical relationship, and therefore, is a part of economic theory. Is the construction of theoretical relationships or models possible without statistical experiments? Certainly not.
(5) Economic Forecasting: Economists do forecasting through statistical studies. By the term forecasting we do not mean some astrological predictions. We only mean to assess and ascertain the future course of certain events which are of economic significance. Thus, on studying the behaviour of price level over several years, the economists can make statistical forecasting about the likely trend or pattern of the price level in the near future. This helps us in future planning.
(6) Formulation of Policies: How does the finance minister decide to increase or decrease taxation as a source of government revenue? Obviously through statistical studies. It is through statistical investigations that the finance minister gets a feedback on the taxpaying capacity of the people, and revenue needs of the government. Accordingly, tax rates are fixed to get maximum possible revenue with minimum possible discomfort to the people.
(7) Economic Equilibrium: What is economic equilibrium? It is a state of balance for the producer or the consumer where the producer finds that his profits are maximum or where the consumer finds that his satisfaction is maximum. It is through the use of statistical methods that the economists have evolved some eco-fundamentals (which you will study in Class XII) telling us how profits of the producers are maximised or how consumers get maximum satisfaction. Thus, so much is the significance of Statistics in economics that Marshall (a great economist of the past century) had to concede that “Statistics are the straw out of which I, like every other economist, have to make bricks.” Surely, Statistics is the hub of the wheel of economic studies, and the beginners of Class XI must focus on the hub to precisely understand the movement of the entire wheel.
Statistical Methods are No Substitute for Common Sense
This is a statement of caution to the students of Statistics. It urges the students not to use Statistics devoid of their common sense. You may find some spurious relationships, like larger the number of doctors in an area greater are the deaths in that area. It may be true statistically, but does not match with common sense. Hence, never propagate any statistical conclusion in case it offends your common sense. Likewise, average size of shoes for the 50 students in your class may be ‘six’. But it would be foolish if the school authorities place an order of 50 shoes of the size-six for all of you. Surely this size may not fit many of you.
Distrust of Statistics
Some people have misgivings about Statistics and make observations like the following:
(i) Statistics is a rainbow of lies.
(ii) Statistics are tissues of falsehood.
(iii) Statistics can prove anything.
(iv) Statistics cannot prove anything.
(v) Statistics are like clay of which you can make a god or a devil, as you please.
According to Disraeli, “There are three kinds of iies-lies, damned lies and Statistics.”
Indeed, one can present statistical information in a manner that tends to distort the facts and thereby mislead the people. For instance, the government claimed that in 2018, per capita income in India increased by about 17 per cent. On the other hand, the opposition party claimed that in 2018, per capita income increased by 5 per cent only. But the difference lies in the fact that whereas government estimates are based on current prices, those of the opposition party are based on the 2011-12 prices, it is difficult for a layman to understand this difference. He will just be confused or perhaps be fooled by the claims and counterclaims of the government and the opposition party.
What Causes Distrust?
Distrust of Statistics arises not because there is anything wrong with Statistics as a subject matter. It arises because the users of Statistics tend to manipulate it to suit or support their pre-drawn conclusions or observations. Main causes for the distrust of Statistics are as under:
(i) Different kinds of Statistics are obtained in respect of a given problem.
(ii) Statistics can be altered to match the predetermined conclusions.
(iii) Authentic Statistics can also be presented in such a manner as to confuse the reader.
(iv) When Statistics are collected in a partial manner, the results are generally wrong. Consequently, people lose faith in them.
However, it may be noted that if Statistics are presented wrongly, then the fault does not lie with Statistics as a subject matter. The fault lies with those people who collect wrong Statistics or those who draw wrong conclusions. Statistics, as such, do not prove anything. They are simply tools in the hands of the statisticians. If a statistician misuses the data, then the blame lies squarely on him and not on the subject matter, A competent doctor can cure a disease by making good use of the medicine but the same medicine in the hands of an incompetent doctor becomes a poison. The fault in this case is not of the medicine but of the unqualified doctor. In the same way, Statistics is never faulty but the fault lies with the users.
In fact, Statistics should not be relied upon blindly nor distrusted outright. “Statistics should not be used as a blind man uses a lamp post for support rather than for illumination, whereas its real purpose is to serve as illumination and not as a support.”
In making use of Statistics one should be cautious and vigilant. In the words of King, “The science of Statistics is the most useful servant, but only of great value to those who understand its proper use.”
It is the duty of the students of economics to make use of know-how of Statistics to discover the truth rather than to cover the truth.
How to Remove Distrust?
Following are some essential remedies of the distrust of Statistics:
(i) Consideration of Statistical Limitations: While making use of Statistics, limitations of Statistics must be taken care of.
(ii) No Bias: The user should be impartial. He should make use only of the relevant data and draw conclusions without any bias or prejudice.
(iii) Application by Experts: Statistics should be used only by the experts to minimise the possibility of misuse.