Please refer to Collection of Data Class 11 Statistics notes and questions with solutions below. These Class 11 Statistics revision notes and important examination questions have been prepared based on the latest Statistics books for Class 11. You can go through the questions and solutions below which will help you to get better marks in your examinations.
Class 11 Statistics Collection of Data Notes and Questions
Statistics means data or quantitative information capable of some meaningful conclusions. The present chapter focuses on the collection of data, including:
(i) sources of data, and
(ii) methods of collecting data.
The purpose of data collection is to understand, analyse and explain a socioeconomic problem, for example, the problem of unemployment or the problem of poverty. While analysing the problem we also try to understand the causes behind the problem as also the possible solutions. The entire exercise needs a comprehensive support of numerical facts, called data.
1. PRIMARY AND SECONDARY SOURCES OF COLLECTION OF DATA
There are two sources of collection of data:
(i) Primary Source, and
(ii) Secondary Source.
Primary Source:
You want to know about the quality of life of the people in your town. You may like to ascertain the quality of life in terms of per capita expenditure of different households in your town. You decide to collect the basic data yourself through statistical survey(s), of course with the help of investigators or field workers. While doing this exercise you are relying on primary source of the data. Thus, primary source of data implies collection of data from its source of origin. It offers you firsthand quantitative information relating to your statistical study. You or your team of investigators are contacting the respondents (people offering basic information) and obtaining the desired quantitative information on per capita expenditure of different households in your town.
Primary source of data implies collection of data from its source of origin. It offers you first-hand quantitative information relating to your statistical study.
Secondary Source:
Secondary Source of collection of data implies obtaining the relevant statistical information from an agency, or an institution which is already in possession of that information. To continue with the previous example, data relating to the quality of life of
the people of your town (or the data on per capita expenditure) may have already been collected by the State Government. You can simply approach the concerned Government department and request for the desired information. This will be a Secondary Source of data for you. Thus, secondary source implies that the desired statistical information already exists and you are simply to collect it from the concerned agency or the department. You are not to conduct statistical survey(s) yourself and you are not to contact the respondents (people offering basic information). OT course, you are not getting first hand information relating to your statistical study. You are simply relying on the information which is already existing.
Secondary source of data implies collection of data from some agency or institution which already happens to have collected the data through statistical survey(s). It does not offer you first-hand information relating to your statistical study. You are to rely on the information which is already existing.
Primary and Secondary Data
Primary source of collecting data offers you, ‘Primary Data’ and secondary source offers you Secondary Data’. Let us clarify the difference.
Primary Data: Data collected by the investigator for his own purpose, for the first time, from beginning to end, are called primary data. These are collected from the source of origin. In the words of Wessel, “Data originally collected in the process oj investigation are known as primary data.” Primary data are original. The concerned investigator is the first person who collects this information. The primary data are, therefore, a first-hand information. To illustrate, you may be interested in studying the socio-economic state of those students in your Class XI who secured first division in their matriculation examination. You collect information regarding their pocket allowance, their family income, educational status, their family members and the like. All this information would be termed as primary information or primary data, since you happen to be the first person to collect this information from the source of its origin.
Secondary Data: In the words of M.M. Blair, “Secondary data are those which are already in existence, and which have been collected, for some other purpose than the answering of the question in hand.” According to Wessel, “Data collected by other persons are called secondary data.” These data are, therefore, called second-hand data. Obviously, since these data have already been collected by somebody else, these are available in the form of published or unpublished reports. For example, data relating to Indian Railways which are annually published by the Railway Board, would be secondary data for any researcher.
Principal Differences between Primary and Secondary Data
The following are some principal differences between primary and secondary data:
(1) Difference in Originality: Primary data are original because these are collected by the investigator from the source of their origin. Against this, secondary data are already in existence and therefore, are not original.
(2) Difference in Objective: Primary data are always related to a specific objective of the investigator. These data, therefore, do not need any adjustment for the concerned study. On the other hand, secondary data have already been collected for some other
purpose. Therefore, these data need to be adjusted to suit the objective of study in hand.
(3) Difference in Cost of Collection: Primary data are costlier in terms of time, money and efforts involved than the secondary data. This is because primary data are collected for the first time from their source of origin. Secondary data are simply collected from the published or unpublished reports. Accordingly, these are much less expensive.
Of course, it may be noted that, there are no fundamental differences between primary data and secondary data. Data are data, whether primary or secondary. These are classified as primary or secondary just on the basis of their collection: first-hand or second-hand. Thus, a particular set of data when collected by the investigator for a specific purpose from the source of origin, would be primary data. And the same set of data, when used by some other investigator for his own purpose, would be known as secondary data. Thus, Secrist has rightly pointed out, “The distinction between primary and secondary data is one of the degree. Data which are primary in the hands of one party may be secondary in the hands of other.’’
Primary and Secondary Data—The Basic Difference
■ If we are collecting data from its source of origin, for the first time, it is primary data.
■ If we are using data which have already been collected by somebody else, it is secondary data.
Note: If you are getting data from somebody else who collected it from its source of origin but did not use it for his own study, it will be deemed as primary data.
2. HOW BASIC DATA IS COLLECTED: SOME STATISTICAL METHODS/ MODES OF DATA COLLECTION
When basic data is to be collected from its primary source, how do we do it? It involves the study of a set of statistical methods or statistical techniques. The following are some of the well-known methods of collecting primary data:
(1) Direct Personal Investigation,
(2) Indirect Oral Investigation,
(3) Information from Local Sources or Correspondents,
(4) Information through Questionnaires and Schedules
(i) Mailing Method, and (ii) Enumerator’s Method.
(1) Direct Personal Investigation The direct personal investigation is the method by which data are personally collected by the investigator from the informants. In other words, the investigator establishes direct relation with the persons from whom the information is to be obtained. The success of this method, however, requires that the investigator should be very diligent, efficient, impartial and tolerant.
Direct contact with the workers of an industry to obtain information about their economic conditions is an example of this method.
Suitability
This method of collecting primary data is suitable particularly when:
(i) the field of investigation is limited or not very large.
(ii) a greater degree of originality of the data is required.
(iii) information is to be kept secret.
(iv) accuracy of data is of great significance, and
(v) when direct contact with the informants is required.
Merits
Data, thus, collected have the following merits:
(i) Originality: Data have a high degree of originality.
(ii) Accuracy: Data are fairly accurate when personally collected.
(iii) Reliability: Because the information is collected by the investigator himself, reliability of the data is not doubted.
(iv) Related Information: When in direct contact with the informants, the investigator may obtain other related information as well.
(v) Uniformity: There is a fair degree of uniformity in the data collected by the investigator himself from the informants. It facilitates comparison.
(vi) Elastic: This method is fairly elastic because the investigator can always make necessary adjustments in his set of questions.
Demerits
However, the method of direct personal investigation suffers from certain demerits, as
under:
(i) Difficult to Cover Wide Areas: Direct personal investigation becomes very difficult when the area of the study is very wide.
(ii) Personal Bias: This method is highly prone to personal bias of the investigator. As a result, the data may lose their credibility.
(iii) Costly: This method is very expensive in terms of the time, money and efforts involved.
(iv) Limited Coverage: In this method, area of investigation is generally small. The results are, therefore, less representative. This may lead to wrong conclusions.
Learning by doing
You are to conduct direct personal investigation on the quality of teaching in a school. Who are your informants? What difficulties do you expect to encounter in such an exercise?
(2) Indirect Oral Investigation
Indirect oral investigation is the method by which information is obtained not from the persons regarding whom the information is needed. It is collected orally from other persons who are expected to possess the necessary information, these other persons are known as witnesses. For example, by this method, the data on the economic conditions of the workers may be collected from their employers rather than the workers themselves.
Suitability
This method is suitable particularly when:
(i) the field of investigation is relatively large.
(ii) it is not possible to have direct contact with the concerned informants.
(iii) the concerned informants are not capable of giving information because of their ignorance or illiteracy.
(iv) investigation is so complex in nature that only experts can give information.
This method is mosdy used by government or non-government committees or commissions.
Merits
Some of the notable merits of this method are as under:
(i) Wide Coverage: This method can be applied even when the field of investigation is very wide.
(ii) Less Expensive: This is relatively a less expensive method as compared to Direct Personal Investigation.
(iii) Expert Opinion: Using this method an investigator can seek opinion of the experts and thereby can make his information more reliable.
(iv) Free from Bias: This method is relatively free from the personal bias of the investigator.
(v) Simple: This is relatively a simple approach of data collection.
Demerits
However, there are some demerits, as under:
(i) Less Accurate: The data collected by this method are relatively less accurate. This is because the information is obtained from persons other than the concerned informants.
(ii) Biased: There is possibility of personal bias of the witnesses giving information.
(iii) Doubtful Conclusions: This method may lead to doubtful conclusions due to carelessness of the witnesses.
Difference between Direct Personal Investigation and Indirect Oral Investigation
The difference between direct personal investigation and indirect oral investigation is as under:
(i) In the case of direct personal investigation, the investigator establishes direct contact with the informants. On the other hand, in the case of indirect oral investigation, information is obtained by contacting other than those about whom information is sought.
(ii) Direct Personal Investigation is generally possible when the field of investigation is small. On the other hand, indirect oral investigation is generally preferred when the field of investigation is relatively large.
(iii) In the Direct Personal Investigation, the investigator must be well versed in the language and cultural habits of the informants. There is no such requirement in the case of Indirect Oral Investigation.
(iv) Direct investigation is relatively costlier than the indirect investigation.
(3) Information from Local Sources or Correspondents
Under this method, the investigator appoints local persons or correspondents at different places. They collect information in their own way and furnish the same to the investigator.
Suitability
This method is suitable particularly when:
(i) regular and continuous information is needed.
(ii) the area of investigation is large.
(iii) the information is to be used by journals, magazines, radio, TV, etc. and
(iv) a very high degree of accuracy of information is not required.
Merits
Principal merits of this method are as under:
(i) Economical: This method is quite economical in terms of time, money or efforts involved.
(ii) Wide Coverage: This method allows a fairly wide coverage of investigation.
(iii) Continuity: The correspondents keep on supplying almost regular information.
(iv) Suitable for Special Purpose: This method is particularly suitable for some specialpurpose investigations, e.g., price quotations from the different grain markets for the construction of Index Number of agricultural prices.
Demerits
Following are some notable demerits of this method:
(i) Loss of Originality: Originality of data is sacrificed owing to the lack of personal contact with the respondents.
(ii) Lack of Uniformity: There is lack of uniformity of data. This is because data is collected by a number of correspondents.
(iii) Personal Bias: This method suffers from the personal bias of the correspondents.
(iv) Less Accurate: The data collected by this method are not very accurate.
(v) Delay in Collection: Generally, there is a delay in the collection of information through this method.
(4) Information through Questionnaires and Schedules
Under this method, the investigator prepares a questionnaire keeping in view the objective of the enquiry. There are two ways of collecting information on the basis of questionnaire:
(i) Mailing Method, and
(ii) Enumerator’s Method.
(i) Mailing Method
Under this method, questionnaires are mailed to the informants. A letter is attached with the questionnaire giving the purpose of enquiry. It is also assured that the information would be kept secret. The informant notes the answers against the questions and returns the completed questionnaire to the investigator.
Suitability
This method is most suited when:
(a) the area of the study is very wide, and
(b) the informants are educated.
Merits
The following are the main merits of this method:
(a) Economical: This method is economical in terms of time, money and efforts involved.
(b) Original: This method is original and therefore, fairly reliable. This is because the information is duly supplied by the concerned persons themselves.
(c) Wide Coverage: This method allows wide coverage of the area of study.
Demerits
However, there are certain demerits of this method as under:
(a) Lack of Interest: Generally, the informants do not take interest in questionnaires and fail to return the questionnaires. Those who return, often send incomplete answers.
(b) Lack of Flexibility: This method lacks flexibility. When questions are not properly replied, these cannot be changed to obtain the required information.
(c) Limited Use: This method has limited use owing to the fact that the questionnaires can be answered only by the educated informants. Thus, this method cannot be used when the informants are uneducated.
(d) Biased: If the informants are biased, then the information will also be biased.
(e) Less Accuracy: The conclusions based on such investigation have only limited accuracy. This is because some questions may be difficult, and consequently accurate answers may not be offered.
(ii) Enumerator’s Method
Under this method, a questionnaire is prepared according to the purpose of enquiry. The enumerator himself approaches the informant with the questionnaire. The questionnaires which are filled by the enumerators themselves by putting questions are called schedules. Thus, under this method, the enumerator himself fills the schedules
after seeking information from the informants. Enumerators are those persons who help the investigators in collecting the data. The enumerators are given training to fill the
schedules and put the questions intelligently to obtain accurate information.
Suitability
This method is mostly used when:
(a) field of investigation is large.
(b) the investigation needs specialised and skilled investigators, and
(c) the investigators are well versed in the local language and cultural norms of the informants.
Investigator, Enumerator and Respondent
■ Investigator is a person who plans and conducts an empirical investigation independently or with the help of others.
■ Enumerator is a person who actually collects the desired statistical information or statistical data. Often the enumerators are trained personnel hired by the investigator for field work.
■ Respondent is a person who answers/responds to the set of questions included in the questionnaire.
Merits
This method has the following merits:
(a) Wide Coverage: This method is capable of a wide coverage in terms of the area involved. Even illiterates can furnish the required information.
(b) Accuracy: There is a fair degree of accuracy in the results. This is because investigations are done by specialized enumerators.
(c) Personal Contact: Unlike in the case of mailing questionnaires, there is personal contact with the informants in this method. Accordingly, accurate and right answers are obtained.
(d) Impartiality: This method is impartial. This is because the enumerators themselves do not need the required information, so they are impartial to the nature of information that they obtain.
(e) Completeness: Schedules have the merit of completeness because these are tilled in by the enumerators themselves.
Demerits
The following are the main demerits of this method:
(a) Expensive: This is a very expensive method of investigation because of the involvement of trained investigators.
(b) Availability of Enumerators: Competent enumerators may not be available. Accuracy of the information accordingly suffers.
(c) Time Consuming: Enumerators may need specialised training for particular investigation. The process of investigation thus becomes time consuming.
(d) Not Suitable for Private Investigation: Since this method is very expensive, it is generally not suitable for private investigation. This method is generally used by the Government institutions.
(e) Partial: If the enumerators are biased, then the data will not be accurate. Construction of Questionnaires and Schedules and their Qualities In the context of collection of Primary data, construction of questionnaires and schedules has the special significance.
The Basic Difference between a Questionnaire and a Schedule
Both show a set of questions. But in case of a questionnaire, the answers are to be recorded/written by the respondents themselves, while in the case of a schedule, answers are to be written/recorded by the enumerators specifically hired for the purpose.
The set of questions in questionnaires and schedules are similar. The only difference that lies between the two is that, in questionnaires, the entire information is recorded by the
informants themselves. In the schedules, on the other hand, the information as supplied by the informants is recorded by the enumerators.
Qualities of a Good Questionnaire
Following are some of the desired qualities of a good questionnaire:
(1) Limited Number of Questions: The number of questions in a questionnaire should be as limited as possible. Questions should be only relating to the purpose of enquiry.
(2) Simplicity: Language of the questions should be simple, lucid and clear. Questions should be short, not long or complex. Mathematical questions must be avoided.
(3) Proper Order of the Questions: Questions must be placed in a proper order.
(4) No Undesirable Questions: Undesirable questions or personal questions must be avoided. The questions should not offend the informants.
(5) Non-Controversial: Questions should be such as can be answered impartially. No controversial questions should be asked.
(6) Calculations: Questions involving calculations by the respondents must be avoided. Investigator himself should do the calculation job.
(7) Pre-Testing Pilot Survey: Some questions be asked from the informants on trial basis. If their answers involve some difficulty these can be reframed accordingly. Such testing is technically called pilot survey.
(8) Instructions: A questionnaire must show clear instructions for filling in the form.
(9) Cross Verification: Such questions may be asked which help cross verifications.
(10) Request for Return: Request should be made to the respondents to return the questionnaire completed in all respects. The informant must be assured that the information conveyed by him will be treated as confidential.
Types of Questions: Some Examples
There are four possible types of questions, as under:
(1) Simple Alternative Questions: These questions are answered in ‘Yes’ or ‘No’, ‘Right or Wrong’ and ‘Good or Bad.’
Example
Do you have a car?
Or
Yes/No
Government decides to introduce 10+2 system in the college.
Do you agree?
Yes/No
(2) Multiple Choice Questions: When there are various possibilities of a particular event, multiple choice questions are generally asked. A number of possible answers are given for such questions. The informant is to tick-mark the one that he feels fit.
Example
What is your mode of conveyance from home to college?
1. On foot
2. Cycle
3. Bus
4. Scooter
Correct answer be tick-marked (/) in the box.
(3) Specific Information Questions: Only specific information is obtained through such questions.
Example
In which class do you read?
Or
How much pocket allowance do you get?
(4) Open Questions: In such questions, the informant is requested to give his views on specific issues.
Example
How can prices in India be controlled?
Or
How can power shortage in the country be overcome?
Example of an Ideal Questionnaire
Objective of this questionnaire is to know about the monthly income and expenditure of the 10+2 students living in the hostels. You are requested to fill in this questionnaire, and return at your earliest convenience. Information furnished in this questionnaire will be kept strictly confidential. The information will be used only for the present investigation.
1. Student’s Name
2. Age
3. Faculty …………………………….. Art/Commerce/Science
4. Name of the School I College
5. Father’s name and address
6. Father’s Occupation ……………………………. Income
7. Income (if any) of other members in the family
8. Monthly income received by the student
(i) From the family …………………………………………………………………………………… ….
(ii) Personal earning …………………………………………………………………………………..
(iii) Scholarship …………………………………………………………………………………………
(iv) Others ………………………………………………………….. .. …………………………………
9. Monthly Expenditure of the Student
Items of Expenditure Amount of Expenditure
(i) School/College fee ………………………………………
(ii) Stationery ………………………………………
(iii) Books ………………………………………
(iv) Conveyance ………………………………………
(v) Hostel expenses ………………………………………
(Vi) Entertainment ……………………. … ……………
(vii) Other items (specify) ………………………………………
10. Is your monthly income enough for you? Yes ………. No
11. If your monthly income is not enough, how do you propose to increase it?
12. Can you save anything from your monthly income? If yes, under which of the abovenoted
heads of expenditures can you save and how much?
Principal Steps in the Planning of a Field Survey (or Field Investigation)
While planning a field survey, you are required to focus on the following steps:
(i) Design questionnaire with utmost care and be sure that:
(a) the questionnaire has a reasonable length.
(b) the questionnaire includes only precise and short questions.
(c) the set of questions in the questionnaire can be cross-checked with each other.
(d) the questions do not involve seriousl difficult calculations for the respondent.
(ii) Decide the mode of enquiry, viz. direct personal oral investigation (also called interview method) or mailing the questionnaire.
(iii) Arrange a proper training programme for the enumerators, explaining to them the purpose and mode of enquiry and also the nature of various questions in the questionnaire.
(iv) Conduct a pilot survey (a small preliminary investigation) when the field of investigation is very large.
Pilot Survey
What it is? It refers to a try-out survey covering a very small sample of the universe of your study. Why do it? This is a sort of pre-testing of your questionnaire. This helps you to assess quality of your questionnaire and the way respondents respond to the set of questions. Accordingly, you are able to know in advance the shortcomings/drawbacks of your questionnaire. Required changes in the questionnaire may be introduced before you are set out for a final survey.
Pilot Survey helps:
(i) in assessing the quality and suitability of questions
(ii) in assessing performance of the enumerators
(iii) in designing a set of instructions for the enumerators
(iv) in assessing the cost and time involved in the final survey.
Main Sources of Errors in Collection of Data
These are the following:
(i) Errors related to the measurement of objects which may occur when: (a) the scale of measurement happens to be different for different enumerators, and (b) different enumerators may be allowing different degree of approximation in their measurement, even while using identical scales.
(ii) Errors occurring due to wrong responses simply because the respondents are not able to handle/understand the questions precisely.
(Hi) Errors occurring due to the lack of response. Some respondents may not respond to the questionnaire. Lack of information thus occurring infuses an element of error in the collection of data.
(iv) Errors occurring due to miscalculations, also called arithmetical errors.
(v) Errors occurring due to ‘communication gap ’or due to lack of recording of the information.
3. COLLECTION OF SECONDARY DATA
There are two main sources of secondary data:
(1) Published Sources, and
(2) Unpublished Sources.
(1) Published Sources
Some of the published sources of secondary data are:
(i) Government Publications: Ministries of the Central and State Governments in India publish a variety of Statistics as their routine activity. As these are published by the Government, data are fairly reliable. Some of the notable Government publications on Statistics are: Statistical Abstract of India, Annual Survey of Industries, Agricultural Statistics of India, Report on Currency and Banking, Labour Gazette, Reserve Bank of India Bulletin, etc.
(ii) Semi-Government Publications: Semi-Government bodies (such as Municipalities and Metropolitan Councils) publish data relating to education, health, births and deaths. These data are also fairly reliable and useful.
(iii) Reports of Committees and Commissions: Committees and Commissions appointed by the Government also furnish a lot of statistical information in their reports. Finance Commission, Monopolies Commission, Planning Commission are some of the notable commissions in India which supply detailed statistical information in their reports.
(iv) Publications of Trade Associations: Some of the big trade associations, through their statistical and research divisions, collect and publish data on various aspects of trading activity. For example, Sugar Mills Association publishes information regarding sugar mills in India.
(v) Publications of Research Institutions: Various universities and research institutions publish information as findings of their research activities. In India, for example, Indian Statistical Institute, National Council of Applied Economic Research publish a variety of statistical data as a regular feature.
(vi) Journals and Papers: Many newspapers such as ‘The Economic Times’ as well as magazines such as Commerce, Facts for You also supply a large variety of statistical information.
(vii) Publications of Research Scholars: Individual research scholars also sometimes publish their research work containing some useful statistical information.
(viii) International Publications: International organisations such as UNO, IMF, World Bank, ILO, and foreign governments etc., also publish a lot of statistical information. These are used as secondary data.
(2) Unpublished Sources
There are some unpublished secondary data as well. These data are collected by the government organisations and others, generally for their self use or office record. These data are not published. This unpublished numerical information may, however, be used as secondary data.
A Note of Caution for the Users of Secondary Data Users of secondary data must check:
(i) reliability of data,
(ii) suitability of data, and
(iii) adequacy of data.
Precautions in the Use of Secondary Data
We know that secondary data are collected by others to suit, their specific requirements. Therefore, one needs to be very careful while using these data. Connor has rightly stated,
“Statistics especially other people’s Statistics are full of pitfalls for the users.” Some of the notable questions to be borne in mind while dealing with the secondary data are: (i) Whether the data are reliable?
(ii) Whether the data are suitable for the purpose of enquiry?
(iii) Whether the data are adequate?
In order to assess the reliability, suitability and adequacy of the data, the following points must be kept in mind:
(1) Ability of the Collecting Organisation: One should check the ability of the organisation which initially collected the data. The data should be used only if it is collected by able, experienced and impartial investigators.
(2) Objective and Scope: One should note the objective of collecting data as well as the scope of investigation. Data should be used only if the objective and scope of the study as undertaken earlier match with the objective and scope of the present study.
(3) Method of Collection: The method of collection of data by the original investigator should also be noted. The method adopted must match the nature of investigation.
(4) Time and Conditions of Collection: One should also make sure of the period of investigation as well as the conditions of investigations. For example, data collected during war times may not be suitable to generalise certain facts during peace times.
(5) Definition of the Unit: One should also make sure that the units of measurement used in the initial collection of data are the same as adopted in the present study. If the unit of measurement differs, data must be modified before use.
(6) Accuracy: Accuracy of the data should also be checked. If the available data do not conform to the required degree of accuracy, these should be discarded.
In short, as stated by Bowley, “It is never safe to take published Statistics at their face value without knowing their meaning and limitations”
Two important Sources of Secondary Data: ‘Census of India’ and Reports and Publications of National Sample Survey Office’
(1) Census of India: Census of India is a decennial publication of the Government of India. It is published by Registrar General & Census Commissioner, India. It is a very comprehensive source of secondary data. It relates to population size and the various aspects of demographic changes in India. Broadly, it includes statistical information
on the following parameters:
(i) Size, growth rate and distribution of population in India.
(ii) Population projections.
(iii) Density of population.
(iv) Sex composition of population.
(v) State of literacy.
Information on these parameters relates to country as a whole as well as different states and union territories of the country. As the name suggests, Census of India is a comprehensive enquiry on population size and the related parameters of change covering each and every household of the country.
(2) Reports and Publications of National Sample Survey Office (NSSO): Reports and publications of NSSO is another important source of secondary data in India. NSSO is a government organisation under the Ministry of Statistics and Programme Implementation. This organisation conducts regular sample surveys to collect basic statistical information relating to a variety of economic activity in rural as well as urban parts of the country. For example, the 76th round of NSSO (July 2018- December 2018) was on “Persons with Disabilities, and Drinking Water, Sanitation, Hygiene and Housing Conditions”. Broadly, reports and publications of NSSO offers statistical information of the following parameters of economic change:
important
The statistical data collected by NSSO are released through its quarterly journal, called SARVEKSHANA and its reports, popularly known as NSSO Reports.
(i) Land and Livestock Holdings.
(ii) Housing Conditions and Migration with special emphasis on slum dwellers.
(iii) Employment and Unemployment status in India.
(iv) Consumer Expenditure in India, including level and pattern of consumer expenditure of diverse categories of the people.
(v) Sources of Household income in India.
Unlike Census of India, Reports and Publications of National Sample Survey Office are based on ‘sample’ study of the population/universe.
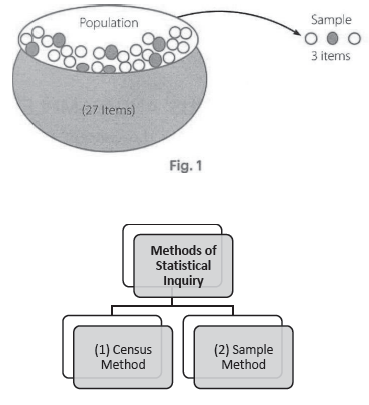
There are 2,000 students in a college. An investigator wants to collect data regarding their family background. He has two possible choices. First, he collects information relating to all the
2.000 students. Second, he collects information relating to some of the students (sample of students) who would represent all the 2.000 students. In Statistics, the first approach for collecting data is called Census Method and the second approach is called Sample Method. The present chapter focuses on a comprehensive study of the census and sample methods of data collection. Beginning with the concepts of Census and Sample techniques the chapter offers a detailed discussion of the merits and demerits of the two techniques. Also, various
techniques of ‘sampling’ are discussed with a comparative look at their merits and demerits.
1. CONCEPTS OF ‘CENSUS’ AND ‘SAMPLE’
Chapter 2 of the book introduces the concept of universe or population. It would be useful to recapitulate this concept for a comprehensive understanding of the concepts of ‘Census’ and ‘Sample’.
In Statistics, universe or population simply refers to an aggregate of items to be studied for an investigation. Ordinarily, the term population is used to mean total number of people living in a country. Population of India was approximately 121.02 crore in 2010- 11. But in Statistics, the term population is used differently. In Statistics, the term population means the aggregate of all items about which we want to obtain information. To illustrate, there are 2,000 students in a particular college. If an investigation relates to all the 2,000 students, then 2,000 would be taken as universe or population. Each unit of these 2,000 is called Item. To further illustrate, l sugar mill out of the 10 sugar mills we are studying, would be called an item. All the 10 sugar mills would constitute population or the universe. If a statistical inquiry is based on all items of the universe,
it is called a census inquiry. For example, if you want to know quality of life of the 25,000 households in your town and you decide to collect the relevant statistical data of all 25,000 households (that is, your statistical inquiry is covering all the items of the universe or is covering the entire universe) you are relying on census method of your statistical inquiry. Alternative is that you collect statistical data for every 5th or 10th household of your town, which you think should represent all the 25,000 households of the town. Now you are not covering each and every item of the universe; instead you are covering only a ‘sample’ of the universe. Characteristics of the ‘sample’ are supposed to represent characteristics of the entire
universe. Or, quality of life of a sample of (say) 2,500 families is supposed to represent quality of life of all the 25,000 families of your town. This is called a sample method of a statistical inquiry.
The concepts of ‘Sample’ and ‘Population’ are projected in Fig. 1. Bigger part of this picture is comprising the entire 27 items showing population or universe and the corresponding part comprising of 3 items shows sample.
Now you must be sure that Sample is only a part of the population or the universe. But it must be that part which, in terms of its characteristics, represents the entire population.
2. CENSUS METHOD
Census method is that method in which data are collected covering every item of the universe or population relating to the problem under investigation.
To illustrate, you may be interested in the investigation of colour composition of the Maruti cars in India. According to the Census Method, you are required to collect data on the colour of each and every Maruti car sold in India.
Census method implies complete enumeration of the universe/ population. Census of population is the most suitable example of tbe census method of a statistical enquiry. For the estimation of the country’s population, house to house enquiry is conducted and even people living at the roadside are contacted in India, census of population is conducted every ten years, and the last census was conducted in February 2011.
Census of India 20V reveals that in terms of the size of population. India is the second largest country in the world next only to China. Suitability
Census method is suitable particularly for such statistical investigations which have (i) small size of population, (ii) widely diverse items in the population, (iii) requirement of intensive examination of different items, and (iv) high degree of accuracy and reliability.
Merits
Principal merits of census method are as under:
(1) Reliable and Accurate: Results based on census method are accurate and highly reliable. This is because each and every item of the population is studied.
(2) Less Biased: Results based on census method are less biased. It is because of the absence of investigator’s discretion regarding the selection of sample items.
(3) Extensive Information: Information collected through the census method is quite exhaustive and therefore, more meaningful because all the items of a universe are examined. For example, population census in India gives exhaustive information relating to the number of people in different parts of the country, their age and sex composition, education, status, occupation, and the like.
(4) Study of Diverse Characteristics: By using census method, one can study diverse characteristics of the universe.
(5) Study of Complex Investigation: When items in a universe are of complex nature and it is necessary to study each item, only census method can produce the desired results. Data on country’s population are collected by this method.
(6) Indirect Investigation: Census method can be successfully used in indirect investigations relating to unemployment, poverty, corruption, etc.
Demerits
However, there are certain demerits of census method as under:
(1) Costly: Census method is very costly and is, therefore, generally not used for ordinary investigations. Only the Government or some big institutions can afford to use this method and that too for specific purposes only.
(2) Large Manpower: Census method requires large manpower (enumerators). Training of a large number of enumerators becomes essential, which is a very difficult process.
(3) Not Suitable for Large Investigations: If the universe comprises a large number of items, then it may not be possible to cover each and every item. Census method becomes practically inoperative in such situations.
3. SAMPLE METHOD
Sample method is that method in which data is collected about the sample on a group of items taken from the population for examination and conclusions are drawn on their basis.
Sample method is widely used in our day-to-day life. A lady in the kitchen, for example, tests only a grain or two of the rice to know whether the rice is boiled or not. By examining only a few drops of blood, a doctor determines the blood group of a person.
Suitability
Sample method is particularly suitable when: (i) the size of population is very large, (ii) very high degree of accuracy is not needed, (iii) intensive examination of diverse items is not required, and (iv) when different units of the universe are broadly similar to each other.
Merits
Some of the principal merits of the sample method are as under:
(1) Economical: Sample method of investigation is economical because only some units of the population are studied.
(2) Time Saving: In this method, only limited number of the items are investigated. As such the process of investigation is time-saving, not time-consuming.
(3) Identification of Error: Because only a limited number of items are covered, errors can be easily identified. To that extent sampling method shows better accuracy.
(4) Large Investigations: Sample method is more feasible in situations of large investigations than the census method which generally involves unaffordable cost.
(5) Administrative Convenience: There is an administrative convenience in handling a limited number of items. More capable and efficient investigators can be appointed.
(6) More Scientific: According to R. Fisher, Sample Method is more scientific because the sample data can be conveniently- investigated from various angles.
Demerits
Yet there are some demerits of the sample method as under:
(1) Partial: It is only a partial investigation of the universe. The investigator’s bias in the selection of the sample is not ruled out. Accordingly, the results may be biased as well.
(2) Wrong Conclusions: If the selected sample does not represent the characteristics of the universe, the study may end up with wrong conclusions.
(3) Difficulty in Selecting Representative Sample: It is not very easy to select a sample which would represent the characteristics of the entire population.
(4) Difficulty in Framing a Sample: Sometimes the universe may be so diverse that it becomes difficult to frame a sample.
(5) Specialised Knowledge: Sampling involves a set of technical procedures. One must have the technical knowledge of choosing a representative sample from the universe.
Persons who are well-versed with all the techniques of sampling are not easily available.
Two Basic Essentials of a Good Sample
These are:
(i) that the sample must represent characteristics of the entire universe/ population.
(ii) that the sample must be adequate enough to offer reliable conclusions.
Essentials of a Sample
In order to arrive at an unbiased and right conclusion, a sample must have the following qualities or essentials:
(1) Representative: A sample must represent all the characteristics of the universe. It is possible only when each unit of the universe stands equal chances of being selected in the sample.
(2) Independent: All units of a sample must be independent of each other. In other words, inclusion of one item in tire sample should not be dependent upon the inclusion of some other items of the universe.
(3) Homogeneity: If more than one sample are selected from a universe, these samples should be homogeneous (and not contradictory) to each other.
(4) Adequacy: The number of items in the sample should be fairly adequate so that some reliable conclusions are drawn covering the characteristics of the universe as a whole.
METHODS OF SAMPLING
Following are the principal methods or techniques of sampling:
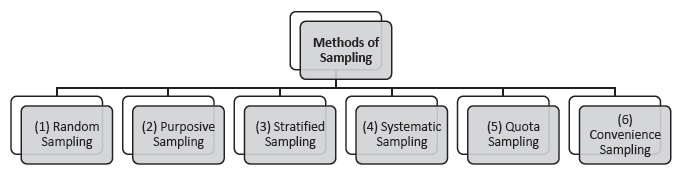
(1) Random Sampling
Random sampling is that method of sampling in which each and every item of the universe has equal chance of being selected in the sample. In other words, there is an equal probability for every item of the universe being selected in the sample.
Which of the various items of the universe would get selected in the sample is beyond the control of the investigator. The selection is left entirely to the chance factors. This method is used particularly when various items of the universe are homogeneous or identical to each other. This method is impartial and economical. Random Sampling may be done in any of the following ways:
(i) Lottery Method: In this method, paper-slips are made for each item of the universe. These slips are shuffled in a box. Then, impartially, some of the slips are drawn to form a sample of the universe.
(ii) Tables of Random Numbers: Some statisticians have prepared a set of tables called Tables of Random Numbers. A sample is framed with reference to these tables. Of all these tables Tippet’s Table is most widely used. Using 41,600 figures, Tippet has involved 10,400 numbers comprising of four units each. For the use of this method, all items of the universe are first arranged in an order. Then using Tippet’s Table the required number of items are selected as are needed for a sample.
Merits
Following points may be noted on the merits of random sampling:
(i) This method is free from personal bias of the investigator.
(ii) Each and every item of the universe stands equal chances of being selected.
(iii) The universe gets fairly represented by the sample.
(iv) This is a very simple and straightforward method.
The Principal Merit of Random Sampling
It is that each and every item of the universe has equal chance (or equal probability) of being selected.
Demerits
However, there are two notable demerits of this method. These are as under:
(i) This method does not guarantee proportionate representation of different items in the universe.
(ii) Random sampling does not give weightage to certain important items in the universe.
Difference Between Random sampling and Haphazard sampling

Random Sampling and Exit Polls
Exit polls is an interesting example of random sampling. What does it mean? It means a small percentage of the people exiting the poll booths are contacted and asked whom
they voted for. From the sample of information thus collected, a prediction is made about the victory chances of different candidates contesting election.
(2) Purposive or Deliberate Sampling
Purposive sampling is that method in which the investigator himself makes the choice of the sample items which in his opinion are the best representative of the universe.
Thus, in this method of sampling, selection of the sample items is not left to the chance factors; it is simply made by choice.
This method of sampling is specifically suitable when some of the items in the universe are of special significance and ought to be included in the sample. For example, if an investigation is to be made relating to the iron and steel industry in India, then the inclusion of such industries as the Tata Iron and Steel Company is obviously a purposive selection.
However, there is a considerable possibility of personal bias in purposive sampling. As a result, it loses its credibility.
Merits
(i) This method is flexible to allow the inclusion of those items in the sample which are of special significance.
(ii) Selection of items can be deliberately tuned to the purpose of study.
(iii) It is a very simple technique of selection of the sample items.
Demerits
(i) There is a possibility of personal bias in the selection of items.
(ii) Because of the possibilities of personal bias, reliability of the results becomes doubtful.
(3) Stratified or Mixed Sampling
This method of sampling is generally adopted when population consists of different groups with different characteristics. According to this method of sampling, population is divided into different strata having different characteristics and some of the items are selected from each strata, so that the entire population gets represented. Each stratum should be represented in correct proportion in the sample. To illustrate, suppose there are 50 students in Class XL Out of them, 30 have studied Mathematics and 20 have studied Home Science in their Class X. Thus, the population of the 50 students gets divided into two strata consisting of 30 and 20 students respectively. From each of these strata, items would be selected proportionately such that the sample represents the characteristics of the entire population. If, of the total 50 students, only a sample of five is to be selected, then we shall randomly select three out of the first stratum (comprising 30 students) and two out of the second stratum (comprising 20 students). However, items may also be selected unproportionately from different strata.
An investigator may prefer to select four students from amongst those who studied Mathematics and only one from amongst those who studied Home Science. The choice will be governed by the nature of the enquiry and wisdom of the investigator.
Stratified Sampling is also called Mixed technique of sampling because this method involves the mixture of both purposive sampling and random sampling. The division of population into different strata is purposely done while selection of the items is done at random.
Merits
(i) This method covers diverse characteristics of the population.
(ii) On the basis of diverse characteristics of the population, a comparative analysis of the data becomes possible.
(iii) This method of sampling offers reliable as well as meaningful results.
Demerits
(i) This method is suitable only when there is a complete knowledge about the diverse characteristics of the population. Therefore, this has a limited scope.
(ii) There is a possibility of bias at the time of classification of the population into different strata.
(iii) When the size of population is already small, it may be difficult to further divide it into smaller parts/strata.
(4) Systematic Sampling
According to this method, units of the population are numerically, geographically and alphabetically arranged. Every nth item of the numbered items is selected as a sample item. To illustrate, if 10 out of 100 students are to be selected for a sample, then 100 students would be numbered and systematically arranged. One item of the first 10 would be selected at random. Subsequently, every 10th item from the selected number will be selected to frame a sample. If the first selected number is 5th item, then the subsequent numbers would be 15th, 25th, 35th, 45th, 55th, 65th, 75th, 85th and 95th. This method of sampling is, in fact, a short-cut method of Random Sampling.
Merits
(i) This is a very simple method. Sample is easily determined.
(ii) There is hardly any possibility of personal bias in this method.
The Principal Merit of Stratified Sampling
It allows selection of such items which represent diverse characteristics of the population.
Principal Demerit of Systematic Sampling It does not allow every item of the universe equal chance (or equal probability) of being selected in the sample.
Demerits
(i) Every item in the population does not get equal chance of being selected because only the first item is selected on the basis of random sampling.
(ii) If all the items in the population are homogeneous, this method of sampling serves no specific purpose.
(5) Quota Sampling
In this method, the population is divided into different groups or classes according to different characteristics of the population. Some percentage of different groups in total population is fixed. Further, some quota of the items to be selected as sample-items is fixed for each group. The investigator selects the fixed number of items from each group to frame a sample.
This method of sampling is not very expensive. But there is a high possibility of personal bias at the time of selection of the items by the investigator. Accordingly, the reliability of results becomes questionable.
(6) Convenience Sampling
In this method, sampling is done by the. investigator in such a manner that suits his convenience. To illustrate, an investigator may select a sample of teachers merely by referring to the college prospectus. This method is the simplest and least expensive, but unscientific and unreliable. It depends too much on the whims of enumerators.
Reliability of Sampling Data
The reliability of the sampling data means that the characteristics of the universe are fully represented by the sample. It depends mainly on the following factors:
(1) Size of the Sample: Reliability of sampling depends on the size of the sample. If its size is very small, it will fail to represent the population. Accordingly, the conclusions would lack reliability.
(2) Method of Sampling: If the method of sampling is not simple and exhaustive, it will not adequately represent the population. Consequently, the results will not be dependable.
(3) Bias of Correspondents and Enumerators: Personal bias of the correspondents and enumerators should be as less as possible. Otherwise, reliability of the sampling data is bound to suffer.
(4) Training of Enumerators: Reliability of sample also depends upon the training of the investigators. If they are not trained to make them expert in their field of investigation, the
sample will lack reliability.
Census and Sampling Methods: A Comparative Look Some of the principal differences between census and sampling methods are as under:
(1) Coverage: In the census technique, an investigator collects information relating to all the items in the population. In sampling method, on the other hand, only some of the items which represent the population are covered for an investigation.
(2) Suitability: Census method is suitable when the area of investigation is relatively small. On the other hand, when the area of investigation is large, it is the sampling method which is generally used.
(3) Accuracy: There is generally a greater degree of accuracy in the results based on the census method than the sampling method. This is because in the census method each and every item of the population is studied. As against it, there is less accuracy and reliability in the sampling method because it studies only a few items of population. However, errors can be easily detected and removed in the sampling method because of the small number of items. To that extent sampling method shows greater accuracy than the census method.
(4) Cost: Sampling method is certainly much less expensive than the census method. Smaller the sample size out of the given population, lesser the cost of investigation.
(5) Time: Sample method is less time consuming than the census method.
(6) Nature of Items: Census method is particularly suitable when the items in the population have diverse characteristics. On the other hand, sample method is suitable when items in the population are homogeneous.
(7) Verification: Verification of the statistical information obtained through census method is generally not possible. It would involve huge expenses and the repetition of the whole process. Sample information, on the other hand, can be easily verified. In case of doubt, enumeration can be done again and facts verified accordingly. In short, sample method of statistical investigation is generally preferred to the census method because the former is less expensive in terms of the time, money and efforts involved. However, for the successful application of the sample method, it is very essential that the sample items represent the characteristics of population as a whole.
Statistical Errors: Sampling and Non-Sampling Errors
Statistical errors are broadly classified as (i) sampling errors, and (ii) non-sampling errors. Following are the details:
(i) Sampling Errors: These are related to the size or nature of the sample selected for the study. Due to a very small size of the sample selected for study or due to nonrepresentative
nature of the sample, the estimated value may differ from the actual value of a parameter. The error thus emerging, is called sampling error. For example, if the estimated value of a parameter is found to be 10 while the actual/true value is 20 then, the sampling error = estimated value of the parameter – true value of the parameter = 10-20 = -10.
(ii) Non-sampling Errors: These are errors related to the collection of data. These are of the following types:
Error of Measurement: Error of measurement may occur due to.- (a) difference in the scale of measurement, and (b) difference in the rounding off procedure adopted by different investigators.
Error of Non-response: This arises when the respondents do not offer the required information. Error of Misinterpretation: This arises when the respondent fails to interpret the questions in the questionnaire.
Error of Calculation or Arithmetical Error: It occurs in the course of addition, subtraction or multiplication of data.
Error of Sampling Bias: It occurs when, for some reason or the other, a part of target population, cannot be included in the choice of a sample.
Larger the field of investigation or larger the population size, greater is the possibility of errors related to the collection of data, or data acquisition. It must be noted here that a non-sampling error is more serious than a sampling error. Because a sampling error can be minimised by opting for a larger sample size. No such possibility exists in case of nonsampling
errors.