Please refer to Data Handling Using Pandas Class 12 Informatics Practices notes and questions with solutions below. These revision notes and important examination questions have been prepared based on the latest Informatics Practices books for Class 12. You can go through the questions and solutions below which will help you to get better marks in your examinations.
Class 12 Informatics Practices Data Handling Using Pandas Notes and Questions
TOPIC – SERIES
Q.1 Print the even positions of numpy_series
Ans.
import pandas as pd
array = np.arange(10,15)
numpy_series = pd.Series(array,index = [‘np1′,’np2′,’np3′,’np4′,’np5’])
Print the even positions of numpy_series
print(numpy_series[::2])
Q.2 Write program for multiplication of two series
Ans.
import pandas as pd
Series1 = pd.Series([11,12,13,14,15])
Series2 = pd.Series([1,2,3,4,5])
Mul_series = Series1 * Series2
print(‘Series 1:-‘)
print(Series1)
print()
print(‘Series 2:-‘)
print(Series2)
print()
print(‘Multiplication: Series 1 * Series 2:-‘)
print(Mul_series)
Q.3 Create a series and print those elements which are divisible by 5
Ans.
import pandas as pd
s1 = pd.Series([10, 21, 33, 14, 15])
print(s1)
for i in range(5):
if s1[i]%5==0:
print(s1[i])
Q.4 Create a series and print those elements which are multiples of 2.
Ans
import pandas as pd
s1 = pd.Series([10, 21, 33, 14, 15])
print(s1)
for i in range(5):
if s1[i]%2==0:
print(s1[i])
Q.5 Create a series such that data elements are twice that of index
Ans.
import pandas as pd
import numpy as np
a=np.arange(1,5)
print(a)
ab=pd.Series(index=a,data=a*2)
print(ab)
Q.6 Write code to find the mean of all the elements in the Series
Ans.
import pandas as pd
import numpy as np
dict1 = {‘Sachin’: 121, ‘Sourav’:100, ‘Dhoni’: 99, ‘Dravid’: 66, ‘Virat’: 75}
dict_series1 = pd.Series(dict1)
print(dict_series1.mean()) #MEAN – Aggregate Function.
Q.7 If s = pd.Series([‘a’,’b’,’c’,’d’,’e’]) is a series then what will be the output of the following:
print(s.iloc[:2])
print(s.iloc[2:3])
Ans.
0 a
1 b
dtype: object
2 c
dtype: object
Q.8 Print numpy series from np1 to np4 with a step of 2.
import pandas as pd
import numpy as np
array = np.arange(10,15)
s = pd.Series(array,index =[‘np1′,’np2′,’np3′,’np4′,’np5’])
Ans.
print(s[‘np1’: ‘np4’:2])
Q.9 Write program for division of two series
Ans
import pandas as pd
import numpy as np
Series1 = pd.Series([11,12,13,14,15])
Series2 = pd.Series([1,2,3,4,5])
IntDivide_series = Series1 // Series2
print(‘Series 1:-‘,Series1)
print()
print(‘Series 2:-‘,Series2)
print()
print(‘Integer Division : Series 1 // Series 2:-‘)
print(IntDivide_series)
Q.10 Write code to compare two series.
Ans
import pandas as pd
ds1 = pd.Series([2, 4, 6, 8, 10])
ds2 = pd.Series([1, 3, 5, 7, 10])
print(“Series1:”,ds1)
print(“Series2:”,ds2)
print(“Compare the elements of the said Series:”)
print(“Equals:”)
print(ds1 == ds2)
print(“Greater than:”)
print(ds1 > ds2)
print(“Less than:”)
print(ds1 < ds2)
TOPIC – DATAFRAME
Consider the following Data Frames:
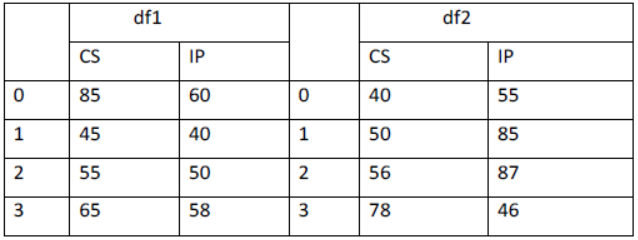
Write the commands to do the following operations on the Data Frames given below:
Q.1 To create the Data Frames df1 and df2.
Ans. Hint- df1=pd.DataFrame({‘CS’:[85,45,55,65],’IP’:[60,40,50,58]})
Q.2 To add Data Frame df1 and df2.
Ans. Hint- df1.add(df2)
Q.3 To subtract Data Frame df2 from df1.
Ans. Hint- df1.sub(df2)
Q.4 To Rename column CS as ComputerSc in Data Frame df1.
Ans Hint- df1.rename(columns={‘CS’:’ComputerSc’})
Q.5 To add a new column Total in Data Frame df1 whose value is equal to the total of both the existing columns values.
Ans. Hint- df1[‘Total’]=df1[‘CS’]+df1[‘IP’]
Q.6 To change the index of Dta Frame df2 from 0,1,2,3 to a,b,c,d
Ans. Hint- df2.rename(index={0:’a’,1:’b’,2:’c’,3:’d’})
Q.7 To display those rows in Data Frame df1 where value of CS column is more than 45.
Ans. Hint- print(df1[df1[‘CS’]>45])
Q.8 To replace all NAN’s in Data Frame df1 to ‘No Value’.
Ans. Hint- df1.fillna(‘No Value’)
Q.9 To Write a command in python to Print the total number of records in the DataFrame df1.
Ans Hint- print(df1.count())
Q.10 To Find the total of all the values of CS column in DataFrame df1.
Ans Hint- df1[‘CS’].sum()
TOPIC – DataFrame : export and import to and from csv file
Q.1 If we export DataFrame with separator other than comma than which one of the following is true?
a) While importing back it merges the columns
b) While importing back it gets imported as it was
c) We cannot export DataFrame with separator other than comma
d. None of these
Ans. a)
Q.2 A DataFrame df1 is exported using the command ‘df1.to_csv(‘file1.csv)’ now if we import back into a DataFrame then it will ______
a) have an ‘unknown column’
b) not have ‘Unknown column’
c) be imported as it was
d) The DataFrame cannot be exported by the given command
Ans. a)
Q.3 A DataFrame df1 is exported using the command ‘df1.to_csv(‘file1.csv)’ now the csv file will be created (location) ______
Ans. In the current folder(The folder where the python program located)
Q.4 Suppose we want to export a DataFrame ‘df1’ to the csv file ‘data1.csv’ in a folder ‘mycsv’ under drive ‘D’ without index. Please write the export command.
Ans df1.to_csv(r’d:\mycsv\data1.csv’, index=False) or df1.to_csv(’d:/mycsv/data1.csv’, index=False)
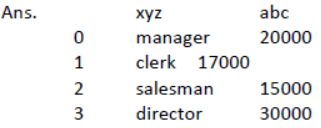
Q.5 The following DataFrame ‘df1’ is exported using the command ‘df.to_csv(‘file1.csv’, index=False, header=False)’. Now write the output of the given python program.
import pandas as pd
df1=pd.read_csv(‘file1.csv’,names=[‘xyz’, ‘abc’])
print(df1)
Q.6. The following DataFrame‘df1’ is exported using the command ‘df.to_csv(‘file1.csv’, index=False)’. Now write the output of the given python program.
import pandas as pd
df1=pd.read_csv(‘file1.csv’, header=None)
print(df1)
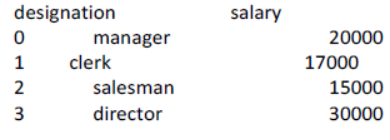
Q.7. Write a python program to export the following DataFrame to the csv file ‘csvfile.csv’ in current folder without the index of the DataFrame.
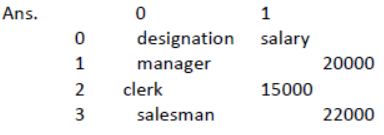
Ans.
import pandas as pd
d={‘Designation’:[‘manager’,’clerk’,’salesman’] ,
‘Salary’:[25000,16000, 12000]}
df=pd.DataFrame(d)
df.to_csv(‘csvfile.csv’, index= False)
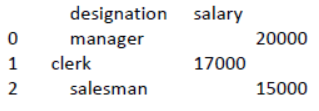
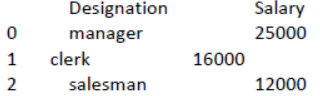
Q.8 Write a python program to export the following DataFrame to the csv file ‘csvfile.csv’ in current folder without the index and column names of the DataFrame.
2 salesman 12000
Ans.
d={‘Designation’:[‘manager’,’clerk’,’salesman’]
,’Salary’:[25000,16000, 12000]}
df=pd.DataFrame(d)
df.to_csv(‘csvfile.csv’, index= False, header=False)
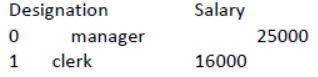
Q.9 A DataFrame having two columns is exported to the csv file ‘csvfile.csv’ without index and column name in the current folder. Write a python program to import the file into a DataFrame with column names as ‘col1’ and ‘col2’ and display that.
Ans
import pandas as pd
df1=pd.read_csv(‘csvfile.csv’, names=[‘col1’, ‘col2’])
print(df1)
Q.10 Write a python program to import data from two csv files ‘file1.csv’ and ‘file2.csv’ and export them to a single csv file ’file3.csv’. All files are in current folder and are exported without index
Ans
import pandas as pd
df1=pd.read_csv(‘file1.csv’)
df2=pd.read_csv(‘file2.csv’)
df3=df1.append(df2)
df3.to_csv(‘file3.csv’, index= False)
TOPIC – Data Visualisation
Q1 The matplotlib Python library developed by ……………………… .
Ans John Hunter.
Q2 ………………… is a module in the matplotlib package.
Ans Pyplot
Q3 The matplotlib API is imported using …………………. .
Ans Import
Q4 The ……………………. is bounding box with ticks and labels.
Ans Axes
Q5 The ……………………. Can be plotted vertically or horizontally.
Ans Bar chart
Q6. Mr Manjeet want to plot a bar graph for the given set of values of subjects on x-axes and number of students who opted for the that subject on y-axes. Complete the code to perform the following operations:
a. To plot the bar graph in statement 1
b. To display the bar graph in statement 2
import matplotlib.pyplot as plt
x= [“Hindi”, “English”, “Maths”, “Science”]
y=[30,40,50,45]
………………… #statement 1
………………… #statement 2
Ans
a) plt.bar(x,y)
b) plt.show()
Q7. Mr. Hamid wants to draw a line chart using a list of elements named Mylist. Complete the code to perform the following operations:
a. To plot a line chart using the given list Mylist.
b. To give a y-axes label to the line chart named Sample number.
import matplotlib.pyplot as plt
Mylist=[40,50,60,70,80,90]
……………………. # statement 1
……………………. # statement 2
plt.show()
Ans
a) plt.plot(Mylist)
b) plt.ylabel(“Sample number”)
Q8. Write a Python program to draw a line using given axis values with suitable label in the x axis , y axis and a title.
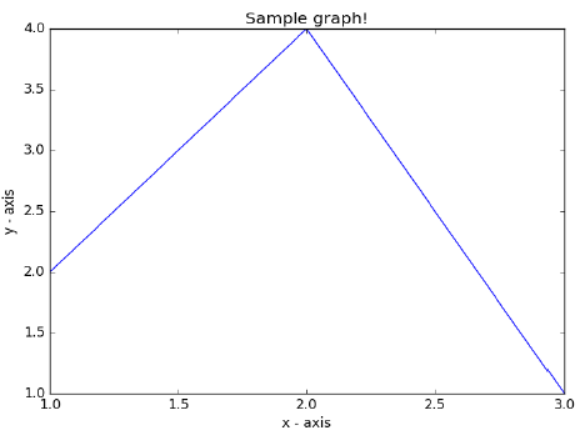
Ans import matplotlib.pyplotas plt
x =[1,2,3]
y =[2,4,1]
plt.plot(x, y)
plt.xlabel(‘x – axis’)
plt.ylabel(‘y – axis’)
plt.title(‘Sample graph!’)
plt.show()
Q9. What is the use of histtype attribute of hist() function of histogram? Mention and explain all it possible values.
Ans histtype attribute is used to draw different types of histogram.
The type of histogram to draw.
a. ‘bar’ is a traditional bar-type histogram. If multiple data are given the bars are arranged side by side.
b. ‘barstacked’ is a bar-type histogram where multiple data are stacked on top of each other.
c. ‘step’ generates a lineplot that is by default unfilled.
d. ‘stepfilled’ generates a lineplot that is by default filled.
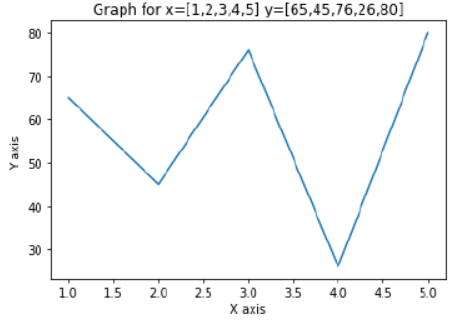
Q10 Write a Python Program to plot line chart for values
x=[1,2,3,4,5]y=[65,45,76,26,80]
Ans
import matplotlib.pyplot as plt
import numpy as np
x=[1,2,3,4,5]
y=[65,45,76,26,80]
plt.plot(x,y)
plt.xlabel(“X axis”)
plt.ylabel(“Y axis “)
plt.title(“Graph for x=[1,2,3,4,5] y=[65,45,76,26,80]”)
plt.show()
#it will look like:
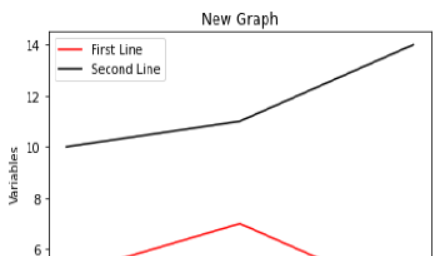
Q11 To add legends, titles and labels to a line plot with multiple lines.
Ans
import matplotlib.pyplot as plt
x=[1,2,3]
y=[5,7,4]
plt.plot(x,y,label=’First Line’,color=’red’)
x2=[1,2,3]
y2=[10,11,14]
plt.plot(x2,y2,label=’Second Line’,color=’black’)
plt.xlabel(‘Plot Number’)
plt.ylabel(‘Variables’)
plt.title(‘New Graph’)
plt.legend()
plt.show()
#it will look like
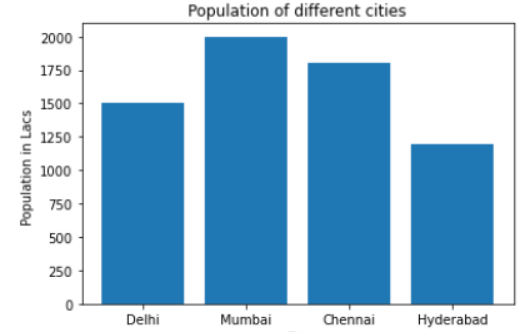
Q12 Write a Python Program to Plot a bar chart for values cities and population.
Ans
import matplotlib.pyplot as plt
import numpy as np
city=[‘Delhi’,’Mumbai’,’Chennai’,’Hyderabad‘]
p=[1500,2000,1800,1200]
plt.bar(city,p)
plt.xlabel(“City”)
plt.ylabel(“Population in Lacs “)
plt.title(“Population of different cities”)
plt.show()
#it will look like:
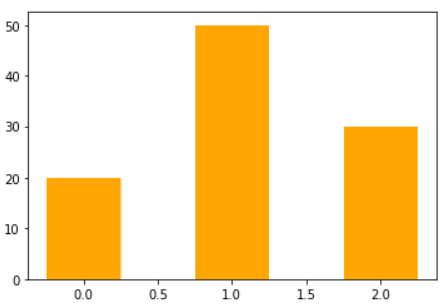
Q13 Write a Python Program to plot a bar chart with width.
Ans
import matplotlib.pyplot as plt
import numpy as np
y_axis=[20,50,30]
x_axis=range(len(y_axis))
plt.bar(x_axis,y_axis,width=.5,color=’orange’)
plt.show()
#it will look like:
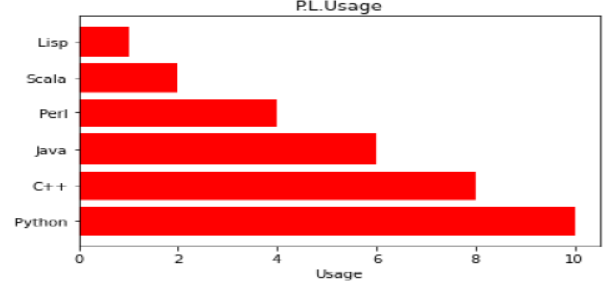
Q14 Write a Python Program to plot a bar chart horizontally
Ans
import matplotlib.pyplot as plt
import numpy as np
ob=(‘Python’,’C++’,’Java’,’Perl’,’Scala’,’Lisp’)
y_pos=np.arange(len(ob))
performance=[10,8,6,4,2,1]
plt.barh(y_pos,performance,align=’center’,color=’r’)
plt.yticks(y_pos,ob)
plt.xlabel(“Usage”)
plt.title(‘P.L.Usage’)
plt.show()
#it will look like:
Q15 Write the code for given bar chart:
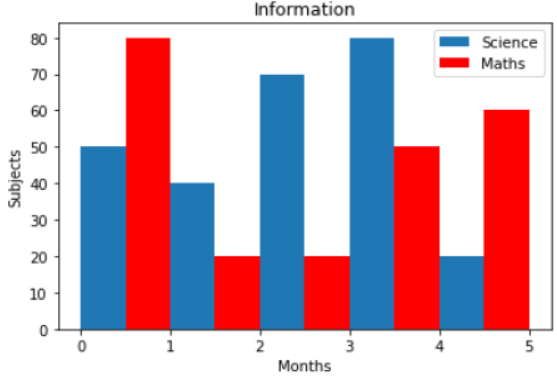
Ans
import matplotlib.pyplot as plt
plt.bar([0.25,1.25,2.25,3.25,4.25],[50,40,70,80,20],label=”Science”, width=.5)
plt.bar([0.75,1.75,2.75,3.75,4.75],[80,20,20,50,60],label=”Maths”,color=’r’,width=.5)
plt.legend()
plt.xlabel(“Months”)
plt.ylabel(“Subjects”)
plt.title(“Information”)
plt.show()
Q16 Are bar charts and histograms the same?
Ans No bar chart and histogram are not the same.
A bar chart has categories of data whereas histogram has number ranges.
The bar in bar chart has gap in between but the bins(bars) of histogram have no gap as number ranges are continuous.
Q17 When should you create histograms and when should you create bar charts to present data visually?
Ans Bar charts should be created when data is categorised. For example if the data consists of average expenditure in each month.
Histogram should be created when data is continuous. For instance if we have to plot the frequency of number between number range in an array. Histogram do not have the gaps between their bars.
Q18 What is cumulative histogram? How do you create it using pyplot?
Ans A cumulative histogram just keep adding its previous values to its present value. It is sum of all the previous bars plus its present bar in a normal histogram. A cumulative histogram is always increasing. For example if we want to know the number of cars sold till 1990,we can use cumulative histogram rather than adding all the bars together.
The argument cumulative = true is used to create cumulative histograms using pyplot. e.g.
plt.hist(x. bins=30, cumulative=true)
Q19 Write a statement to plot a cumulative histogram of stacked bar type for ndarray x and y.
Ans plt.hist( [x,y], histtype = ‘barstacked’, cumulative = True)
Q20 Seema want to plot a cumulative histogram, he write following code:
import matplotlib.pyplot as plt
sale=[68,75,78,74,81,82,71,79,74,81,78,72]
plt.hist( sale, cumulative = False)
plt.show()
Above code didn’t show the cumulative histogram. What changes should Seema make?
Ans
import matplotlib.pyplot as plt
sale=[68,75,78,74,81,82,71,79,74,81,78,72]
plt.hist(sale, cumulative = True)
plt.show()
Q21 Write a program to create a histogram for data=[1,11,15,21,31,33,35,37,41] and bins =[0,10,20,30,40,50,60] color of bars should yellow with red edge color.
Ans
import matplotlib.pyplot as plt
data=[1,11,15,21,31,33,35,37,41]
plt.hist(data,bins=[0,10,20,30,40,50,60], edgecolor=”red”, facecolor=’Yellow’)
plt.show()
Q22 Write a program to create histogram that plot two ndarray x and y with 48 bins, in stacked horizontal histogram.
Ans
import matplotlib.pyplot as plt
x=[78,72,69,81,63,67,65,75,79,74,71,83,71,79,83,63]
y=[84,77,91,87,69,78,69,89,87,79,79,89,81,98,89,69]
plt.hist([x,y], bins=24, histtype=’barstacked’, cumulative=True, orientation=’horizontal’)
plt.show()
Write code to add title and axis titles to code of Question 22
import matplotlib.pyplot as plt
x=[78,72,69,81,63,67,65,75,79,74,71,83,71,79,83,63]
y=[84,77,91,87,69,78,69,89,87,79,79,89,81,98,89,69]
plt.hist([x,y], bins=24, histtype=’barstacked’, cumulative=True, orientation=’horizontal’)
plt.title(“Stackedbar Histogram”)
plt.xlable(“X-axis”)
plt.ylable(“Y-axis”)
plt.show()
We hope the above Data Handling Using Pandas Class 12 Informatics Practices are useful for you. If you have any questions then post them in the comments section below. Our teachers will provide you an answer. Also refer to MCQ Questions for Class 12 Informatics Practices