Please refer to Measures of Central Tendency Class 11 Statistics notes and questions with solutions below. These Class 11 Statistics revision notes and important examination questions have been prepared based on the latest Statistics books for Class 11. You can go through the questions and solutions below which will help you to get better marks in your examinations.
Class 11 Statistics Measures of Central Tendency Notes and Questions
1. CONCEPT AND DEFINITION OF CENTRAL TENDENCY
A Central Tendency refers to an average or a central value of a statistical series. It is difficult for anyone to understand or remember a large group of raw data. One would like to know the critical value which represents all the items in a series. Such a value is called ‘central tendency’ or ‘average value’. For instance it is very difficult to remember and understand the data concerning the income of millions of Indians. However, if it is
said that in 2016-17, provisional estimates for average income of the people in India was Rs. 82,269 per annum, it will be easy for us to guess the economic condition of most of the Indians. It is this average value which is called central tendency of the series. It is also called measure of location. Thus, measures of central tendency refer to all those methods of statistical analysis by which averages of the statistical series are worked out.
Definition
According to Croxton and Cowden, “An average is a single value within the range of the data that is used to represent all of the values in the series. Since an average is somewhere within the range of data, it is sometimes called measure of central value. ”
According to Clark, “An average is a figure that represents the whole group.”
2. PURPOSE AND FUNCTIONS OF AVERAGES
Study of averages is of central significance in statistical methods. That is why Bowley defines statistics as, “A Science of Averages”.
What is the Basic Purpose of Finding an Average Value of a Series?
It is to identify such a value that represents characteristics of all the items in the series.
According to Moroney, “The purpose of an average is brief and simple representation of a group of individual values so that the brain may quickly grasp the general basis of the units of the group. ’’ Some of the main purposes and functions of averages are as under:
(1) Brief Description: The main purpose of an average is to present a brief description of the principal features of the raw data. As a result, data are easily understood.
(2) Comparison: Averages help in making comparison of different sets of data. For example, a comparison of the per capita income of India and USA shows that per capita income of India is much less than the per capita income of USA. Accordingly, it is concluded that India is a poor country.
(3) Formulation of Policies: Averages help in formulation of policies. For example, in India the per capita income is Rs. 82,269 per annum which is much less than many countries in the world. Accordingly, it becomes clear for the government to focus on such economic policies as are likely to increase per capita income.
(4) Statistical Analysis: Averages constitute the basis of statistical analysis. For example, if one knows the average marks secured by the students of a class in their different subjects, one can easily analyse the subjects in which the students are weak.
(5) One Value for All: Averages represent the universe or the mass of statistical data. One value represents all values of the series. Accordingly, conclusion can be drawn in respect of the universe as a whole.
3. ESSENTIALS OF A GOOD AVERAGE
A good and satisfactory average should have the following features:
(1) Clear and Stable Definition: A good and a satisfactory average should be clear and stable in definition.
(2) Representative: An average value should be representative of the entire mass of data. It should be based on all the observations of the series.
(3) Simplicity: Simplicity is another essential feature of a good average. It must be so simple that it is easily worked out.
(4) Certainty: A good average must be certain in character. Only then an average value can be used as the basis of statistical analysis.
(5) Absolute Number: A good average should be an absolute number. A percentage or a relative value does not serve as a good average.
(6) Least Effect of a Change in the Sample: An average of a series should be least affected by a change in the sample on which the average is based.
(7) Algebraic Treatment: A good average should be capable of further mathematical or algebraic treatment.
4. TYPES OF STATISTICAL AVERAGES
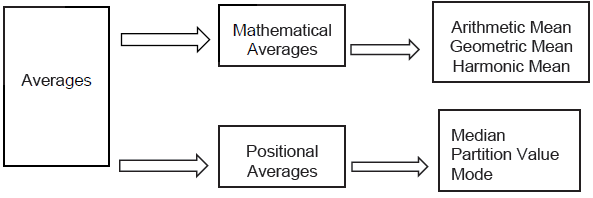
Averages are broadly classified into two categories:
(1) Mathematical’ Averages, and
(2) Positional Averages.
In the present chapter we discuss arithmetic mean.
5. ARITHMETIC MEAN
Arithmetic Mean is a simple average of all items in a series. It is the simplest measure of central tendencies. The arithmetic mean of a series is simply called ‘Mean’. If. for example, Ram plays 5 matches, Shyam 6, Mohan 7, Kishan 8 and Ravi 9 matches a week, the average number of matches played by Ram, Shyam, Mohan, Kishan and Ravi would be determined as under:
Number of Matches = 5+ 6 + 7 + 8 + 9 = 35
Number of Boys = 5
Mean = Total Value of the Items/Number of Items = 35/5 = 7
What is the basic difference between Simple Arithmetic Mean and Weighted Arithmetic Mean?
In simple arithmetic mean, all items of the series are taken as of equal importance. In the weighted average, on the other hand, different items are taken as of different importance;
accordingly, weights are accorded to different items depending on their relative importance.
Definition
Arithmetic Mean or Mean is the number which is obtained by adding the values of all the items of a series and dividing the total by the number of items.
In the words of H. Secrist, “The Arithmetic Mean is the amount secured by dividing the sum of value of the items in a series by their numbers. ”
FORMULA
Arithmetic mean is generally written as X. It may be expressed in the form of following formula:
X̅ = X1 + X2 + X3 + ⋯ … + Xn/N= 𝛴X/ N
Here, X1; X2, X3, Xn are the values of different items in the series. Thus, X, = matches played by Ram, 5; X2= matches played by Shyam, 6 and X3= matches played by Mohan,
7, etc.
N = Total number of items (in the above example, it is 5 comprising of five boys, Ram, Shyam, Mohan, Kishan and Ravi).
Σ is a sign called Sigma. It refers to the sum total of the values of different items in the series.
Types of Arithmetic Mean
Arithmetic mean is of two types:
(1) Simple Arithmetic Mean: In it, all items of a series are given equal importance.
(2) Weighted Arithmetic Mean: In it, different items of a series are accorded different weights in accordance with their relative importance.
Methods of Calculating Simple Arithmetic Mean
We know, there are three types of statistical series:
(1) Individual Series
(2) Discrete Series
(3) Frequency Distribution.
Arithmetic mean may be calculated with respect to these series using different methods.
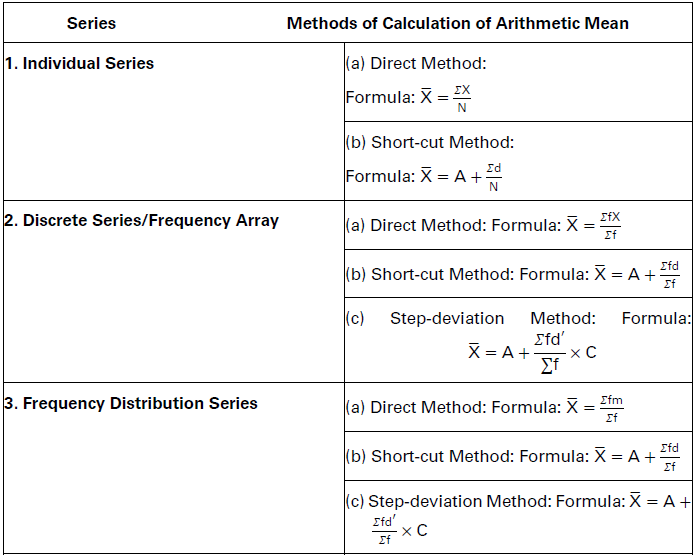
Calculation of Simple Arithmetic Mean in Case of Individual Series
In the case of individual series, arithmetic mean may be calculated by two methods:
(1) Direct Method
(2) Short-cut Method.
(1) Direct Method
Following steps are involved in this method:
(i) Add up values of all the items of a series (ΣX);
(ii) Find out total number of items in the series (N); and
(iii) Divide the total of value of all the items (ΣX) with the number of items (N). The
resultant value would be the arithmetic mean. Thus,
FORMULA
X̅ = 𝛴X/N OR X = TOTAL VALUE OF THE ITEMS/NUMBER OF ITEMS
Illustration.
Pocket allowance of 10 students is Rs. 15, 20, 30, 22, 25, 18, 40, 50, 55 and 65. Find out the average pocket allowance.
Solution:
Average pocket allowance of the 10 students = Rs. 34.


(2) Short-cut Method
This method is used when the size of items is very large.
The use of short-cut method involves the following steps:
(i) Before finding an actual average, some value in the series is taken as ‘assumed average’. Assumed average should preferably be the middle item of the series. It facilitates the calculation of deviation from the assumed average.
(ii) Assumed average is generally taken by dividing by 2, the total of maximum and minimum values of the items. It is always a complete number. In statistics, assumed average is often denoted as A’.
(iii) Deviations of different values from the assumed average are found and each deviation is written against the concerned value in the series. Thus, d (deviation) = X – A
Where, X is the actual value in the series and A is the assumed average. If value of the item (X) is less than the assumed average (A), then ‘d’ or X – A would be negative. Thus,
in the earlier illustration, if A is 40, ‘d’ corresponding to 1st value in the series (15) would be, 15 – 40 = (-) 25. Likewise corresponding to 8th value in the series (50) it would be, 50-
40 = ( + ) 10.
While noting down the deviation against a particular item, sign of the deviation (+) or (-) must also be specified. Thus, ‘d’ of the first value would be written as, – 25 and of the 8th value as, +10.
(iv) Find the sum/total of all deviations. Add up positive deviations and negative deviations separately; and then find out the difference. If the sum of negative deviations is more than that of positive deviations then net sum of all the deviations will be negative and vice versa.
(v) Divide the net sum of the deviations by the number of items in the series. If the dividend is positive (+) then it gets added to A, the assumed average. And, if the dividend is negative (-), then it gets subtracted from A, the assumed average. The value, thus, obtained would be the actual average of the series.
FORMULA
𝑋 ̅ = 𝐴 + Σ𝐷/𝑁
(Here, X = Arithmetic mean; A = Assumed average; Σd = Net sum of the deviations of the different values from the assumed average; N = Number of items in the series.)
Illustration.
Following is the pocket allowance of 10 students. Find out arithmetic mean using Shortcut Method.

Solution:
(Assumed Average, A = 40)


The sum of “+’ deviations = + 50
The sum of deviations =-110
The net sum of deviations, Σd= – 110 + 50 = – 60
Dividing the aggregate of deviations (Σd) by the number of items (N),
𝛴d/N = −60/10 = −6
Substituting this value of 𝛴d/N in the following formula:
X = A + 𝛴𝐷/N
We have,
X = 40 + (-) 6 = 40-6 = 34
Arithmetic Mean = Rs. 34.
Calculation of Simple Arithmetic Mean in Case of Discrete Series or Frequency Array Individual series do not have frequencies of the items. These series show only values of different items.
In discrete series, there are frequencies corresponding to different items in the series.
There are three methods of calculating mean of the discrete series.
That discrete series (also called frequency array) do not have class intervals. An item in the series does not assume any range of values but each item has corresponding frequency.
(1) Direct Method
(2) Short-cut Method
(3) Step-deviation Method.
(1) Direct Method
Direct method of calculating mean of the discrete series involves the following steps:
(i) Values of the various items in the series are indicated by X, and their frequencies by ‘f’.
(ii) Each item is multiplied by its frequency to get ‘fX’. These multiples are added to get
ΣFX. That is,
ΣFX = f1X1 + f2X2+… + fnXn
(iii) Frequencies are added up to get Σf. That is,
Σf=f, + f2 + f3 + ………………………………………….. + fn ‘
(iv) ΣfX is divided by Σf to obtain the mean, X.
FORMULA
X̅ = 𝛴FX/𝛴𝐹
Illustration.
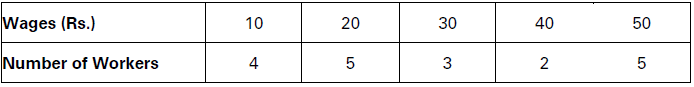
Following is the weekly wage earnings of 19 workers:

Calculate arithmetic mean using Direct Method.
Solution:

X̅ = 𝛴FX/𝛴F = 560/19 = 29.47
Mean wage earnings of 19 workers = Rs. 29.47.
(2) Short-cut Method
Short-cut method of estimating mean of the discrete frequency series uses the following formula:
FORMULA
X̅ = A + 𝛴fd/𝛴f
Steps
(i) Before calculating the actual average of the series, some value which lies in the middle of the series is taken as assumed average. This may be indicated by ‘A’. In the earlier example, assumed average may be taken as 50.
(ii) Deviation of each value of different items in the series is calculated from the assumed average. The deviation is noted against the concerned item of the series. The deviation may be positive (+) or negative (-). Accordingly, the,(4) or (-) sign is to be noted against each deviation. If the deviation is zero, no sign needs to be specified.
(iii) Find the multiple of ‘d’ and its corresponding ‘f’, that is, ‘fd’. Add up, separately, the positive (+) and negative (-) values of all ‘fd’. Find out the difference between the two to get ‘Σfd.
(iv) Add up all frequencies, to get Σf.
(v) Divide Σfd by Σf that is, 𝛴fd/𝛴f If the value of 𝛴fd/𝛴f is positive, it gets added to the assumed average. If this value is negative, it gets subtracted from the assumed average. The result would be the actual average of the series.
Illustration.
Following are the wages of 19 workers:
Calculate arithmetic mean, using Short-cut Method.
Solution:
(Assumed Average, A = 30)
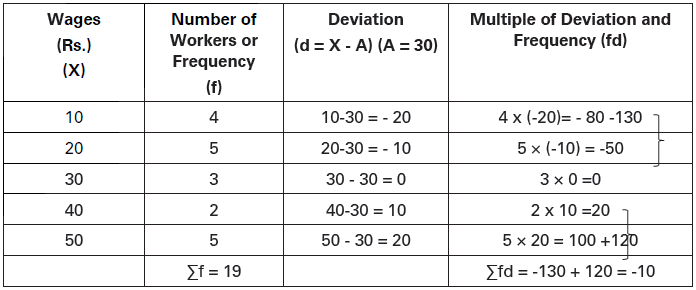
X̅ = A + 𝛴fd/𝛴f = 30 + −10/19 = 30 − 10/19
= 30 – 0.53 = 29.47
Arithmetic Mean = Rs. 29.47.
(3) Step-deviation Method
This method is a variant of short-cut method. It is adopted when deviations from the assumed mean have some common factor. In the above example, all the deviations (d) can be divided by 10 which is a common factor in this case. The common factor may be indicated by ‘C’. The deviation (d) when divided by the common factor C is called stepdeviation. This may be indicated by d’
Steps
(i) Step deviation d’ is obtained by dividing the deviation (of the actual value from the assumed average) by the common factor.
d′ = X − A / C= d/C
(Here, d’ = Step deviation; C = Common factor; d = Deviation; X = Value of the item; A = Assumed average.)
(ii) Each step deviation is multiplied with its frequency to get fd’. Sum total of the fd’ is obtained to get Σfd’.
(iii) Σfd’ is divided by Σf, and then multiplied by the common factor ‘C’. The resultant value is added to A to get the actual average of the series. Thus,
FORMULA
X̅ = A + 𝛴fd′/𝛴f × C
Illustration.
Wage rate of 19 workers is given below;

Calculate arithmetic mean using ‘Step-deviation Method.’
Solution:
(Assumed Average, A = 30)

X̅ = A + Σfd′/𝛴f × C
A = 30, C = 10 and 𝛴fd′/𝛴f = −1/19 = −0.053
Putting these values in the formula;
X̅ = 30 + −1/19 × 10= 30 – 0.053X10
= 30-0.53 = 29.47
Arithmetic Mean = Rs. 29.47.
Calculation of Simple Arithmetic Mean in Case of Frequency Distribution in case of a frequency distribution, items are classified into different class intervals like 5-10, 10-15, etc. Each class interval has its frequency. There are three methods of calculating mean in frequency distribution:
(1) Direct Method
(2) Short-cut Method
(3) Step-deviation Method.
(1) Direct Method
This method involves the following steps:
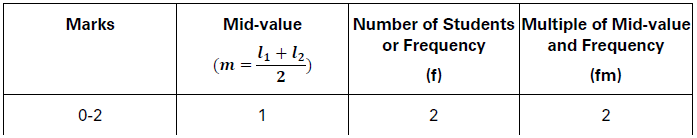
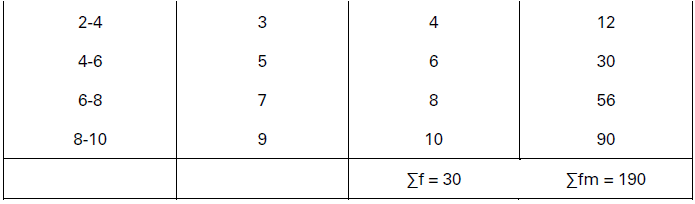
(i) The mid-values of the class intervals are calculated. These may be indicated by ‘m To find the mid-value of class intervals, the lower and upper limits of that class are added and then divided by ‘2’. Thus, mid-value of the class 10- 20 would be determined as:
m = 𝑙1 + 𝑙2/2 = 10 + 20/2 = 30/2 = 15
(Here, m = Mid-value; l↓ = Lower limit of the class; /2 = Upper limit of the class.)
(ii) Mid-values are multiplied by their corresponding frequencies. The multiples ‘fin’ are added up to get Σfm.
(iii) Σfm is divided by Σf. The resultant value would be the mean value.
FORMULA
X̅ = Σfm/Σf
Illustration.
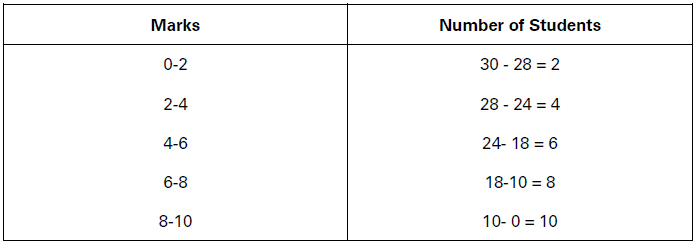
The following table shows marks in English secured by students of Class X in your school in their examination. Calculate mean marks using Direct Method.

Solution:

X̅ = 𝛴fm/𝛴f = 3,620/140 = 25.86
Mean Marks = 25.86.
(2) Short-cut Method
This method involves the following steps:
(i) Mid-values of the classes are determined, and indicated by
(ii) Deviations of the mid-values from the assumed average (A) are determined and indicated by ‘d’. If negative, these deviations are written as -d, and if positive, these are written as -l-d.
(iii) Deviations (d) are multiplied by the frequencies (f) to get ‘fd’. These are then added up to get Σfd.
(iv) Σfd is divided by Σf. The dividend is added to the assumed average. The resultant value would be the mean value.
FORMULA
X̅ = A + Σfd/Σf
Illustration.
The following table shows marks secured by the students of a class in an examination in English:
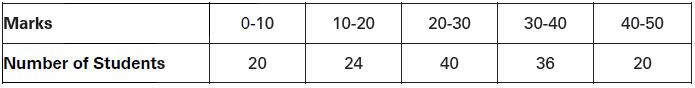
Calculate mean marks using Short-cut Method.
Solution:

𝛴fd/𝛴f = 120/140 = 0.86
X̅ = A + 𝛴fd/𝛴f = 25 + 0.86 = 25.86
Mean Marks = 25.86.
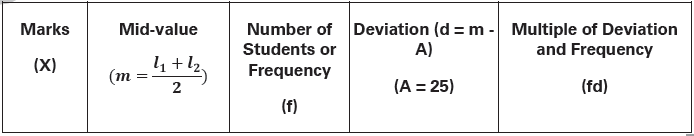
(3) Step-deviation Method
Step-deviation method is a very useful method of calculating mean value in the case of frequency distribution. It involves the following steps:
(i) Find out mid-values of the class intervals, indicated by ‘m\
(ii) Find out deviations of the mid-values from some assumed average. That is, d = m – A
(iii) Find out step-deviations by dividing the deviations with some Common Factor (C) that is, d′ = d/C
(iv) Multiply step-deviations (d’) with the corresponding frequencies (f). Add up all the multiples to get Σfd’.
(v) Divide Σfd’ by Σf and then multiply it by C. The resultant value is added to A to get the mean value. Thus,
FORMULA
X̅ = A + 𝛴fd′/𝛴f × C
Illustration.
The following table shows marks obtained by the students of a class in their test in English:

Calculate arithmetic mean using Step-deviation Method.
Solution:
(Assumed Average, A = 25)
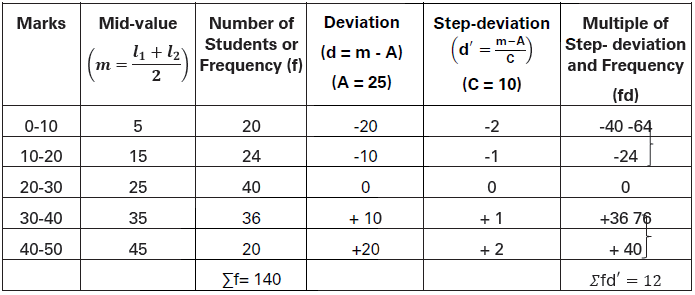
𝛴fd′/𝛴f = 12/140 = 0.086
Mean, X̅ = A + 𝛴fd′/𝛴f × C
= 25 + 0.086 × 10
= 25 + 0.86 = 25.86
Arithmetic Mean = 25.86 marks.
Calculation of Arithmetic Mean in Case of Cumulative Frequency Distribution Here are two illustrations to facilitate your understanding.
Illustration 1.
Marks in Statistics of the students of Class XI are given below. Find out arithmetic mean.

Solution:
A Cumulative Frequency Distribution should first be converted into a Simple Frequency Distribution, as under:
Conversion of a Cumulative Frequency Distribution into a Simple Frequency Distribution

Now, mean value of the data is obtained using Direct Method as under:
Calculation of Mean


X̅ = 𝛴fm/𝛴f = 1,265/49 = 25.82
Arithmetic Mean = 25.82 marks.
Illustration. 2
The following table shows marks in economics of the students of a class. Calculate arithmetic mean.

Solution:
Converting Cumulative Frequency Distribution into a Simple Frequency Distribution, we get the following:
Arithmetic mean of this continuous series is estimated below, using Direct Method.
Calculation of Arithmetic Mean using Direct Method
X̅ = 𝛴fm/𝛴f = 190/30 = 6.33
Arithmetic Mean — 6.33 marks.
Calculation of Arithmetic Mean in a Mid-value Series Here is an illustration.
Illustration.
Following table gives marks in Statistics of the students of a class. Find out mean marks..
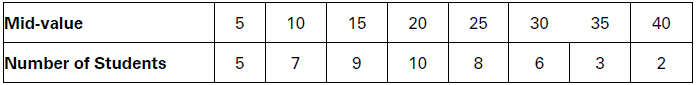
Solution:
In this series, mid-values are already given. The calculation of arithmetic mean involves the same procedure as in the case of exclusive series.
Calculation of Arithmetic Mean
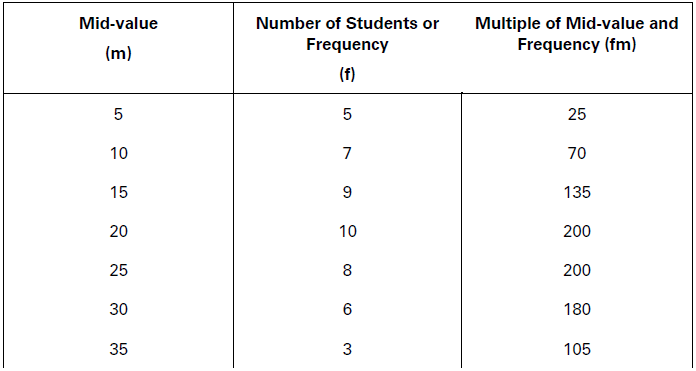
X̅ = 𝛴fm/𝛴f = 995/50 = 19.9
Mean Marks =19.
Calculation of Arithmetic Mean in Case of Inclusive Series
Illustration.
The following table shows monthly pocket expenses of the students of a class. Find out the average pocket expenses.

Solution:
Calculation of arithmetic mean of inclusive series is the same as of exclusive series.

X̅ = A + 𝛴fd′/𝛴f× C
= 44.5 +(−20/30) × 10
= 44.5 − 20/30
= 44.5-6.67 = 37.83
Average Pocket Expenses = Rs. 37.83.
Calculation of ‘Corrected’ Arithmetic Mean
Sometimes, in the calculation of Arithmetic Mean, some items or values are wrongly written. Accordingly, the mean value goes wrong. But such mean value can be corrected,
as illustrated below: X̅ = 𝛴X(Wrong)+( Correct value )−( Incorrect value )/N
Illustration.
Mean marks obtained by 100 students are estimated to be 40. Later on it is found that one value was read as 83 instead of 53.
Find out the “corrected” mean.
Solution:
X̅ = 𝛴X/N
Or, 𝛴X =X̅/N
Given: X̅ = 40; N = 100 ΣX
40 = 𝛴𝑋/100
ΣX(wrong) = 40×100 = 4,000
Correct value = 53
Incorrect value = 83
Correct X̅ = ΣX(WRONG) + ( CORRECT VALUE ) − ( INCORRECT VALUE )/N
= 4,000 + 53 − 83/100
= 3,970/100
= 39.70
Thus, Corrected Mean = 39.70.
Finding the Missing Value
If mean of the series is known, but one value is missing, the missing value may be found using the following formula:
X̅ = X1 + X2 + X3 + ⋯ + Xn/N
Illustration.
Suppose mean of a series of 5 items is 30, Four values are, 10, 15, 30 and 35 respectively.
Find the missing (5th) value of the series.
Solution.
Assume 5th value as X5.
X̅ = X1 + X2 + X3 + X4 + X5/N
Given: X1 = 10, X2 = 15, X3 = 30, X4 = 35, X5 = ?
X̅ = 30, N = 5/30 = 10 + 15 + 30 + 35 + X5/5
= 90 + X5/5
∴ 30 × 5 – 90 + X5
Or, 150 = 90 + X5
∴ X5= 150-90 = 60
Thus, Value of the 5th item = 60.
WEIGHTED ARITHMETIC MEAN
We have so far discussed Simple Arithmetic Mean. In simple arithmetic mean, all items of a series are taken as of equal significance. But sometimes we may give greater significance to some items and less to others. As household may, for example, give more significance to food, less to clothes and still less to entertainment. When different items of a series are weighed according to their relative importance, the average of such series is called Weighted Arithmetic Average. A Weighted Arithmetic Average is, thus, the mean of weighted items.
Calculation of Weighted Mean
Calculation of weighted mean involves the following steps:
(i) Different items are weighed according to their significance. Weights are indicated by ‘W’.
(ii) Items (X) are multiplied by their corresponding weights (W) and added up to get ΣWX.
(iii) ΣWX is divided by the sum total of weights, i.e., ΣW, to get the mean value, that is,
FORMULA
X̅ w = 𝛴WX/𝛴W
Here, X̅
w indicates weighted average.
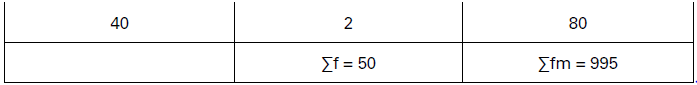
Illustration.
Calculate weighted mean of the following data:
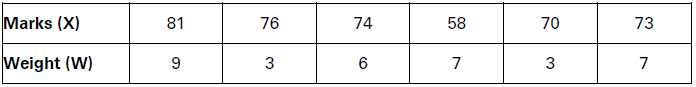
Solution:
Calculation of Weighted Mean
Weighted Mean,
X̅w =𝛴WX/𝛴W
= 1,96l/28
= 70.04
Weighted Mean = 70.04 marks.
COMBINED ARITHMETIC MEAN
Given the mean values of two or more parts of a series and the number of items in each part, one can get Combined Arithmetic Mean, or mean of the series as a whole. The
following formula is used for the estimation of combined arithmetic mean:
FORMULA
X̅1,2 = X̅/1N1 +X̅/2N2/N1 + N2 Here,
X̅1,2 = Combined arithmetic mean of parts 1 and 2 of a series;
X̅1 = Arithmetic mean of part 1 of the series;
X̅2 = Arithmetic mean of part 2 of the series;
N1 = Number of items in part 1 of the series;
N2 = Number of items in part 2 of the series.
Likewise, when there are more than 2 parts ofa series, the following formula is used to work out Combined Arithmetic Mean. *
FORMULA
X̅1,2,3,…,n =X̅1N1 +X̅2N2 + ⋯ +X̅nNn/N1 + N2 + ⋯ + Nn
Illustration.
60 students of Section A of Class XI, obtained 40 mean marks in Statistics, 40 students of Section B obtained 35 mean marks in Statistics. Find out mean marks in Statistics for
Class XI as a whole.
Solution:
Given:
N1 = 60, X̅1 = 40, N2 = 40, X̅2 – 35
We know, X̅12 = X̅1N1+X̅2N2/N1+N2
X̅12 = 40 × 60 + 35 × 40/60 + 40
X̅12 = 2,400 + 1,400/100
= 3,800/100
= 38
Thus, Combined Arithmetic Mean = 38.
Addition, Subtraction, Multiplication and Division of Values
If some specific value is added to or subtracted from different items in a series, the mean value of the items would increase or decrease by the same specific value respectively. Likewise, if different items of a series are multiplied or divided by any specific value, the mean value of the items would be the multiple or divided by the same specific value. The following example illustrates this point:

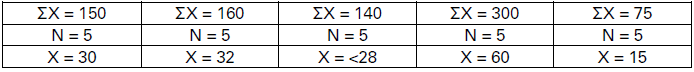
The example shows that: (i) if 2 is added to different items, the resultant average of the series also increases by 2 (30 + 2 = 32); (ii) if 2 is subtracted from the different items, the
resultant average also decreases by 2 (30 – 2 = 28); (hi) if the items are multiplied by 2, the resultant average also increases by the multiple of 2 (30 × 2 = 60); and (iv) if different
items are divided by 2 the resultant average will also be divided by 2 (30 => 2 = 15).
Location of Missing Item or Frequency
A missing item (referring to any value of a variable X) or a missing frequency (f) of a series can be located using the following equations:
X̅ = 𝛴X/N X̅
= 𝛴fX/𝛴f(N = 𝛴f)
𝛴X =X̅ N 𝛴fX =X̅
𝛴f/N = 𝛴X
X̅/𝛴𝑓 = 𝛴𝑓𝑋/𝑋̅
Illustration 1.
In the following frequency distribution, the frequency of the class interval (40-50) is not known. Find it, if the arithmetic mean of the distribution is 52.

Solution:
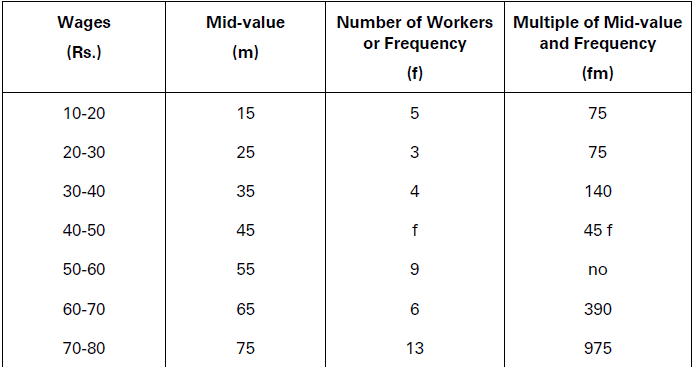

X̅ = Σfm/𝛴f
52 = 1,765 + 45𝑓/33 + 𝑓
Or, 52 (33 + f) = 1,765 + 45f
1,716 + 52f = 1,765 + 45f
52f – 45f = 1,765- 1,716
=> 7f = 49
=> f = 7
Missing Frequency = 7.
Illustration 2.
If the arithmetic mean of the following series is 115.86; find the missing value.
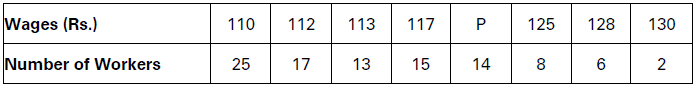
Solution:
Let the missing value be X.

X̅ = 𝛴fX/𝛴f
115.86 = 9,906 + 14X 100
115.86 × 100 = 9,906 + 14X/14X = 11,586-9,906
14X = 1,680
X = 1,680/14
= 120
Missing Value = 120.
A Notable Property of Arithmetic Mean
A notable property of arithmetic mean is that the sum of deviations of different items of a series, when deviations are taken from arithmetic mean, is always zero. This important notable property of arithmetic mean can be proved by the following example. The sum of the deviations from its arithmetic mean would be zero. This is worked out as under:
Illustration.
Show that in the series of marks 10, 20, 30, 40, 50 obtained by five students the sum of deviations from arithmetic mean is zero.
Solution:
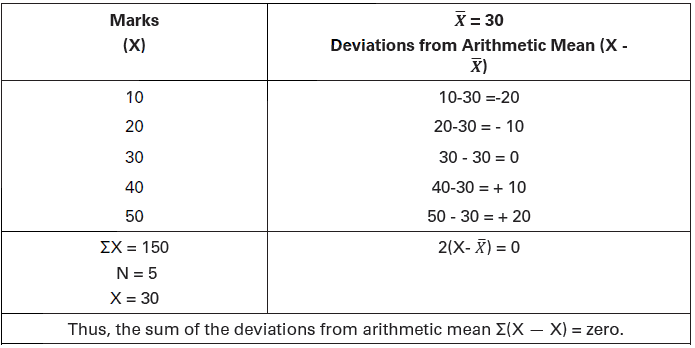
Properties of Arithmetic Mean (AM)
(i) The sum of deviations of the items from AM is always zero.
(ii) The sum of squared deviations of the items from AM is minimum.
(iii) If each item of a series is increased, decreased, multiplied or divided by some constant then AM also increases, decreases, multiplies or is divided by the same constant.
(iv) The product of the AM and the number of items on which mean is based is equal to the sum of all given items.
(v) if each item of the original series is replaced by the actual mean, then the sum of these substitutions will be equal to the sum of the individual items.
The Principal Merit of Arithmetic Mean
That it is based on all items of the series and is capable of further algebraic treatment.
The Principal Demerit of Arithmetic Mean
End-use of the goods is the principal basis of classifying the goods as intermediate goods and final goods.
Merits and Demerits of Arithmetic Mean
Merits
The following are some of the main merits of arithmetic mean:
(1) Simple: From the viewpoint of calculation and usage, arithmetic mean is the simplest of all the measures of central tendency.
(2) Certainty: Arithmetic mean is a certain value; it has no scope for estimated values.
(3) Based on All Items: Arithmetic mean is based on all the items in a series. It is, therefore, a representative value of the different items.
(4) Algebraic Treatment: Arithmetic mean is capable of further algebraic treatment. It is, therefore, extensively used in statistical analysis.
(5) Stability: Arithmetic mean is a stable measure of central tendency. This is because changes in the sample of a series have minimum effect on the arithmetic average.
(6) Comparison: Being stable and certain, arithmetic mean can be easily used for comparisons.
(7) Accuracy Test: Arithmetic mean can be tested for its accuracy as a representative value of the series.
Demerits
Arithmetic mean suffers from following demerits:
(1) Effect of Extreme Value: The main defect of arithmetic mean is that it gets distorted by extreme values of the series. Therefore, it is not always an accurate measure. To illustrate, pocket expenditure of a rich student of Class XI may be Rs. 2,000, while his
four friends incur pocket expenditure of Rs. 100, Rs. 80, Rs. 70 and Rs. 50 respectively.
The average pocket expenditure of all the five students would be:
X̅ = 2,000 + 100 + 80 + 70 + 50/5 = 2,300/5 =7–460
Certainly this is not such an accurate mean of the pocket expenditure of five students as 4 out of 5 students incur pocket expenditure just ranging between Rs. 50 to Rs. 100. The
mean value of Rs. 460 is largely owing to the fact that there is an extreme value of Rs. 2,000 in the series. Such a mean is certainly not a representative value of all the items in the series.
(2) Mean Value may not figure in the series at all: The mean value may sometimes be that value which does not figure in the series at all.
The average of 2, 3 and 7 is 2+3+7/3 = 4 which is not there in the series. It further erodes its representative character.
(3) Laughable Conclusions: Arithmetic mean sometimes offers laughable conclusions. If there are 50 students in Class XI and 51 students in Class XII, the average strength of
these two classes would come to 50+51/2 = 50.5 students, which is indeed very funny because there cannot be half student.
(4) Unsuitability: Arithmetic mean is not a suitable measure in case of percentage or proportionate values.
(5) Misleading Conclusions: Arithmetic mean sometimes offers misleading conclusions.
Following example illustrates this point:
Income of Two Individuals A and B for the years 2016-2018

In the given Table, average income of both A and B is same suggesting that A and B have been equally rich during the years 2016 to 2018. But a close examination of the series
should reveal that while the income of A is increasing over years, that of B is decreasing.
Thus, arithmetic mean offers misleading conclusions.
However, despite certain demerits of arithmetic mean as noted above, this is an ideal measure of the central tendency. this is the most widely used measure in practical life.
Arithmetic mean is particularly significant in such series of which different items are equally important and therefore, equally weighed. Average output, average cost,
average revenue, are some of the well-known concepts in Economics based on arithmetic mean.
Calculation of Arithmetic Mean for Different Series: A Glance