Please refer to Presentation of Data Class 11 Statistics notes and questions with solutions below. These Class 11 Statistics revision notes and important examination questions have been prepared based on the latest Statistics books for Class 11. You can go through the questions and solutions below which will help you to get better marks in your examinations.
Class 11 Statistics Presentation of Data Notes and Questions
The presentation of data means exhibition of the data in such a dear and attractive manner that these are easily understood and analysed. There are many forms of presentation of data of which the following three are well known: (i) Textual or Descriptive Presentation,
(ii) Tabular Presentation, and
(iii) Diagrammatic Presentation. The present chapter focuses on Textual and Tabular Presentation of data. Diagrammatic Presentation of data is discussed in the next chapter.
1. TEXTUAL PRESENTATION
In textual presentation, data are a part of the text of study or a part of the description of the subject matter of study. Such a presentation is also called descriptive presentation of data. This is the most common form of data presentation when the quantity of data is not very large. Here are some examples:
Example 1
In a strike call given by the trade unions of shoe making industry in the city of Delhi, 50% of the workers reported for the duty, and only 2 out of the 20 industries in the city were totally closed.
Example 2
Surveys conducted by a Non-government Organisation reveal that, in the state of Punjab, area under pulses has tended to shrink by 40% while the area under rice and wheat has tended to expand by 20%, between the years 2001-2011.
Suitability
Textual presentation of data is most suitable when the quantum of data is not very large. A small volume of data presented as a part of the subject matter of study becomes a useful supportive evidence to the text. Thus, rather than saying that price of gold is skyrocketing, a statement like price of gold has risen by 50% during the financial year 2017- 18 is much more meaningful and precise. One need not support the text with voluminous data in the form of tables or diagram when the textual matter itself is very small and includes only a few observations. Indeed, textual presentation of data is an integral component of a small quantitative description of a phenomenon. It gives an emphasis of statistical truth to the otherwise qualitative observations.
Drawbacks
A serious drawback of die textual presentation of data is that one has to go through the entire text before quantitative facts about a phenomenon become evident. A picture or a set of bars showing increase in the price of gold during a specified period is certainly quite informative even on a casual glance of the reader. Textual presentation of data, on the other hand, does not offer anything to the reader at a mere glance of the text matter. The reader must read and comprehend (he entire text. When the subject under study is vast and involves comparison across different areas/countries, textual presentation of data would only add to discomfort of the reader.
2. TABULAR PRESENTATION
In the words of Neiswanger, “A statistical table is a systematic organisation of data in columns and rows” Vertical dissections of table (||) are known as columns and horizontal dissections (=) are known as rows.
Tabulation is the process of presenting data in the form of a table. According to Prof. L.R. Connor, ‘tabulation involves the orderly and systematic presentation of numerical data in a form designed to elucidate the problem under consideration. ”
In the words of Prof. M.M. Blair, “Tabulation in its broadest sense is an orderly arrangement of data in columns and rows.”
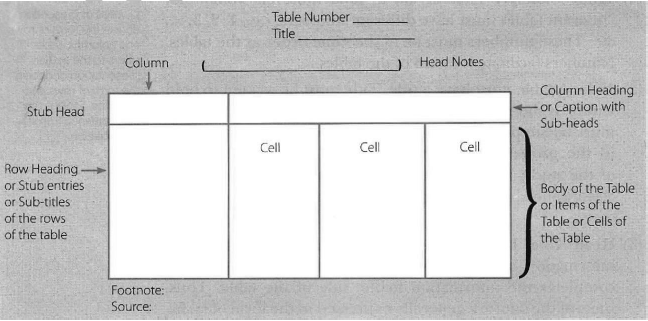
Components of a Table
Following are the principal components of a table:
(1) Table Number: First of all, a table must be numbered. Different tables must have different numbers, e.g., 1, 2, 3, etc. These numbers must be in the same order as the tables. Numbers facilitate location of the tables.
(2) Title: A table must have a title. Title must be written in bold letters. It should attract the attention of the readers. The title must be simple, clear and short.
A good title must reveal:
(i) the problem under consideration,
(ii) the time period of the study,
(iii) the place of study, and
(iv) the nature of classification of data. A good title is short but complete in all respects.
(3) Head Note: If the title of the table does not give complete information, it is supplemented with a head note. Head note completes the information in the title of the table. Thus, units of the data are generally expressed in the form of lakhs, tonnes, etc. and preferably in brackets as a head-note.
(4) Stubs: Stubs are titles of the rows of a table. These titles indicate information contained in the rows of the table.
(5) Caption: Caption is the title given to the columns of a table. A caption indicates information contained in the columns of the table. A caption may have sub-heads when information contained in the columns is divided in more than one class. For example, a caption of ‘Students’ may have boys and girls as sub-heads.
(6) Body or Field: Body of a table means sum total of the items in the table. Thus, body is the most important part of a table. It indicates values of the various items in the table. Each item in the body is called ‘cell’.
(7) Footnotes: Footnotes are given for clarification of the reader. These are generally given when information in the table need to be supplemented. «
(8) Source: When tables are based on secondary data, source of the data is to be given. Source of the data is specified below the footnote. It should give: name of the publication and publisher, year of publication, reference, page number, etc.
Difference between Table and Tabulation
While tabulation refers to the method or process of presenting data in the form of rows and columns, table refers to the actual presentation of data in the form of rows and columns. Table is the consequence (result) of tabulation.
Check [he following format of a table showing its various components:
Guidelines for the Construction of a Table or Features of a Good Table
Construction of a table depends upon the objective of study. It also depends upon the wisdom of the statistician. There are no hard and fast rules for the construction of a table. However, some important guidelines should be kept in mind. These guidelines are features of a good table. These are as under:
(1) Compatible Title: Title of a table must be compatible with the objective of the study. The title should be placed at the top centre of the table.
(2) Comparison: It should be kept in mind that items (cells) which are to be compared with each other are placed in columns or rows close to each other. This facilitates comparison.
(3) Special Emphasis: Some items in the table may need special emphasis. Such items should be placed in the head rows (top above) or head columns (extreme left). Moreover, such items should be presented in bold figures.
(4) Ideal Size: Table must be of an ideal size. To determine an ideal size of a table, a rough draft or sketch must be drawn. Rough draft will give an idea as to how many rows and columns should be drawn for presentation of the data.
(5) Stubs: If rows are very long, stubs may be given at the right hand side of the table also.
(6) Use of Zero: Zero should be used only to indicate the quantity of a variable. It should not be used to indicate the non-availability of data. If the data are not available, it should be indicated by ‘n.a.’ or (-) hyphen sign.
(7) Headings: Headings should generally be written in the singular form. For example, in the columns indicating goods, the word ‘good’ should be used.
(8) Abbreviations: Use of abbreviations should be avoided in the headings or subheadings of the table. Short forms of the words such as Govt., m.p. (monetary policy), etc. should not be used. Also such signs as “(ditto)” should not be used in the body of the table.
(9) Footnote: Footnote should be given only if needed. However, if footnote is to be given, it must bear some asterisk mark (*) corresponding to the concerned item. (10) Units: Units used must be specified above the columns. If figures are very large, units may be noted in the short form as ‘000’ hectare or ‘000’ tonnes.
(11) Total: In the table, sub-totals of the items must be given at the end of each row. Grand total of the items must also be noted.
(12) Percentage and Ratio: Percentage figures should be provided in the table, if possible. This makes the data more informative.
(13) Extent of Approximation: If some approximate figures have been used in the table, the extent of approximation must be noted. This may be indicated at the top of the table as a part of head note or at the foot of the table as a footnote.
(14) Source of Data: Source of data must be noted at the foot of the table. It is generally noted next to the footnote.
(15) Size of Columns: Size of the columns must be uniform and symmetrical.
(16) Ruling of Columns: Columns may be divided into different sections according to similarities of the data.
(17) Simple, Economical and Attractive: A table must be simple, attractive and economical in space.
Kinds of Tables
There are three basis of classifying tables, viz., (1) purpose of a table, (2) originality of a table, and (3) construction of a table. According to each of these bases, statisticians have classified tables as in the following flow chart:
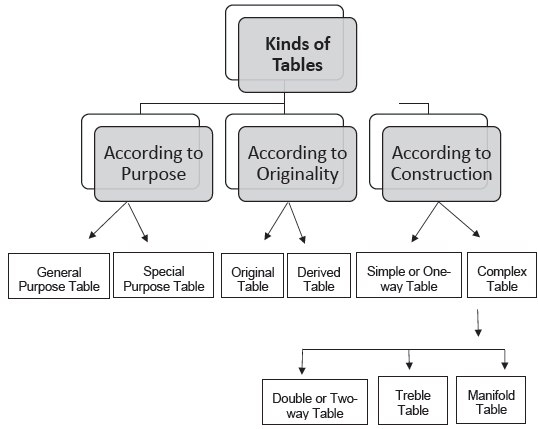
Let us attempt a brief description of the various kinds of tables:
(1) Tables according to Purpose
According to purpose, there are two kinds of tables:
(i) General Purpose Table: General purpose table is that table which is of general use. It does not serve any specific purpose or specific problem under consideration. Such tables are just ‘data bank’ for the use of researchers for their various studies. These tables are generally attached to some official reports, like Census Reports oflndia. These are also called Reference Tables.
(ii) Special Purpose Table: Special purpose table is that table which is prepared with some specific purpose in mind. Generally, these are small tables limited to the problem under consideration. In these tables data are presented in the form of result of the analysis. That is why these tables are also called summary tables.
(2) Tables according to Originality
On the basis of originality, tables are of two kinds: (i) Original Table: An original table is that in which data are presented in the same form and manner in which they are collected. (ii) Derived Table: A derived table is that in which data are not presented in the form or manner in which these are collected. Instead the data are first converted into ratios or percentage and then presented.
(3) Tables according to Construction
According to construction, tables are of two kinds:
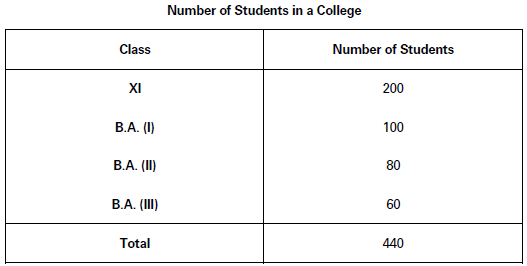
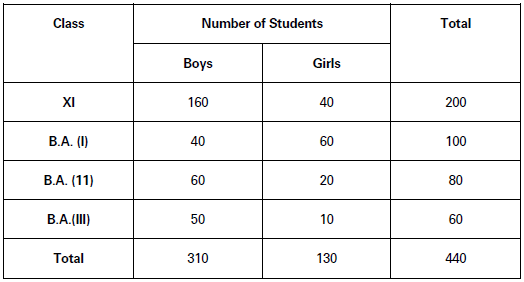
(i) Simple or One-way Table: A simple table is that which shows only one characteristic of the data. Table 2 below is an example of a simple table. It shows number of students in a college:
(ii) Complex Table: A complex table is one which shows more than one characteristic of the data. On the basis of the characteristics shown, these tables may be further classified as:
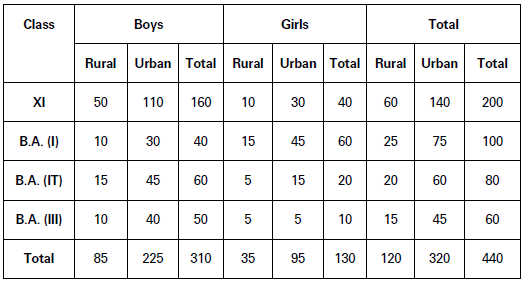
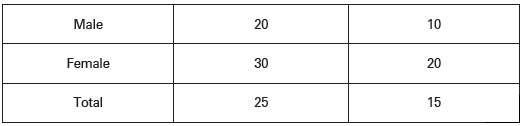
(a) Double or Two-way Table: A two-way table is that which shows two characteristics of the data. For example, Table 3, showing the number of students in different classes according to their sex, is a two-way table:
Number of Students in a College
(According to Sex and Class)
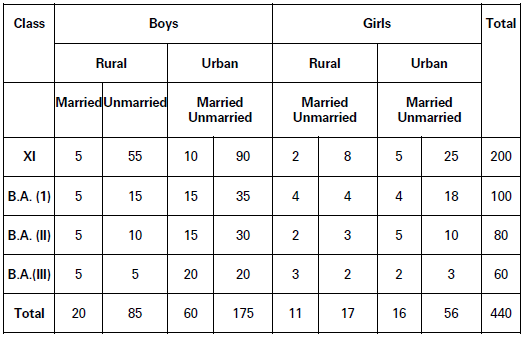
(b) Treble Table: A treble table is that which shows three characteristics of the data. For example, Table 4 shows number of students in a college according to class, sex and habitation.
Number of Students in a College
(According to Class, Sex and Habitation)
(c) Manifold Table: A manifold table is the one which shows more than three characteristics of the data. Table 5, for example, shows number of students in a college according to their sex, class, habitation and marital status.
Number of Students in a College
(According to their Sex, Class, Habitation and Marital Status)
Classification of Data and Tabular Presentation
Tabular presentation is based on four-fold classification of data, viz., qualitative, quantitative, temporal, and spatial. Following are the details with suitable illustrations.
(1) Qualitative Classification of Data and Tabular Presentation:
Qualitative classification occurs when data are classified on the basis of qualitative attributes or qualitative characteristics of a phenomenon. Example: Data of unemployment may relate to rural-urban areas, skilled and unskilled workers, or male and female job-seekers. Table 6 below is an example of tabular presentation of data when data are classified on the basis of qualitative attributes or qualitative characteristics.
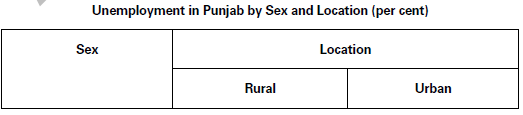
(This is an imaginary table. In this table, male and female are such characteristics/attributes which are qualitative and cannot be quantified.)
(2) Quantitative Classification of Data and Tabular Presentation:
Quantitative classification occurs when data are classified on the basis of quantitative characteristics of a phenomenon.
Example: Data on marks in Mathematics by the students of Class XII in CBSE examination. Table 7 shows tabular presentation of data when data are classified on the basis of quantitative characteristics.
Marks Obtained by Students of Class XII of XYZ School
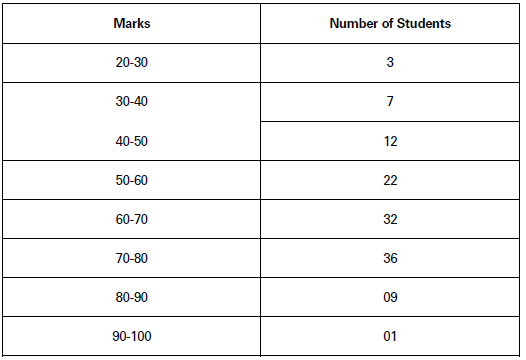
Source: Result Sheets
Here, marks are a quantifiable variable and data are classified in terms of different class intervals of marks.
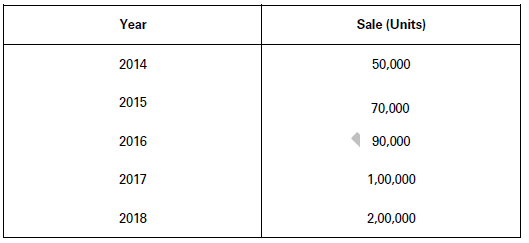
(3) Temporal Classification of Data and Tabular Presentation:
In temporal classification, data are classified according to time, and time becomes the classifying variable.
Example: Sale of Cell phones in different years during the period 2014-2018 in the city of Delhi. Table 8 shows tabular presentation of data on the basis of temporal classification.
Annual Sale of Cell Phones in the City of Delhi (2014-2018)
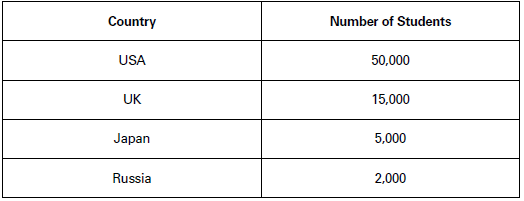
(4) Spatial Classification:
In spatial classification, place/location becomes the classifying variable. It may be a village, a town, a district, a state or a country as a whole.
Example: Number of Indian students studying in different countries of the world during a particular year. Table 9 is an example of tabular presentation based on spatial classification of data.
Indian Students in different Countries of the World (2018)

Merits of Tabular Presentation
Following are the principal merits of tabular presentation of data:
(1) Simple and Brief Presentation: Tabular presentation is perhaps the most simplest form of data presentation. Data, therefore, are easily understood. Also, a large volume of statistical data is presented in a very brief form.
(2) Facilitates Comparison: The tabulation facilitates comparison of data by presenting the data in different classes.
(3) Easy Analysis: It is very easy to analyse the data from tables. It is by organising the data in the form of table that one finds out their central tendency, dispersion and correlation.
(4) Highlights Characteristics of Data: Tabulation highlights characteristics of data.
Accordingly, it becomes easy to remember the statistical facts.
(5) Economical: Tabular presentation is a very economical mode of data presentation. It saves time as well as space.