Please refer to Index Numbers Class 11 Statistics notes and questions with solutions below. These Class 11 Statistics revision notes and important examination questions have been prepared based on the latest Statistics books for Class 11. You can go through the questions and solutions below which will help you to get better marks in your examinations.
Class 11 Statistics Index Numbers Notes and Questions
1. CONCEPT AND DEFINITION OF INDEX NUMBERS
The concept of index number can be best understood through an illustration. Let us consider a situation of rising prices during the year 2018. In this context, we are faced with three basic questions. First, compared to which year have the prices risen during 2018? Second, how do we handle the situation when the prices of some goods rise more than the others? Thirdly, can prices of different goods be expressed in terms of any standard unit or different units are to be used to express prices of different goods and services, such that the price of milk is to be expressed in terms of rupees per liter, of cloth in terms of rupees per meter and of sweets in terms of rupees per kilogram. The study of Index Numbers answers all these questions: First, rise in prices during 2018 would be studied only with reference to some previous years like 2001 or 2004. Otherwise, the mere statement that prices during 2018 have tended to rise would make no sense. 2018 will be treated as the current year and 2001 or 2004 as the base year. Prices during the base year are taken as 100. Prices during the current year are related to the base year price. So that, we find out percentage change in price level over the years. Level of price is called the index of price. Since price of the base year is assumed to be 100, we can say that index of price of the base year is always 100. If base year is 2004 and the price index is 100, and if in the year 2018 prices are doubled, we shall conclude that the index of price in the year 2018 has shot up to 200 compared to 100 in the base year. As regards the second question (how do we handle the situation when prices of some goods change more than the others) the study of index numbers suggests to take average change. Thus, if the price of Potatoes has rises from 100 to 200 and the price of Onions has risen from 100 to 300, we shall consider average change only, viz. 200+300/2 = 250
Thus, it is the average index of prices for the various goods and services which is constructed for different years, and compared with the base year.
Third, as regards the problem of expressing the prices of various goods and services in some homogeneous units, the theory of Index Numbers suggests to consider only percentage change in prices of various goods and services. Once a change in price is expressed as a percentage change, the unit of the commodity (like litre of a milk, or meter of a cloth) loses its relevance.
Thus, what does the study of Index Numbers do? It helps us to find out percentage change in the values of different variables (may be prices of different goods or production of different commodities) over time with reference to some base year which happens to be the year of comparison. When various goods are studied simultaneously, the percentage change is taken as the average for all the goods.
Definition
In the words of Spiegel, “An Index Number is a statistical measure designed to show changes in a variable or group of related variables with respect to time, geographic location or other characteristics”.
According to Croxton and Cowden, “Index Numbers are devices for measuring difference in the magnitude of a group of related variables”.
2. FEATURES OR CHARACTERISTICS OF INDEX NUMBERS
Following are the three specific features or characteristics of index numbers:
(1) Relative Changes: Index numbers measure relative or percentage changes in the variable(s) over time. Index number of prices, for example, is not simply a statement of prices at different dates, it presents estimates of percentage changes in the prices over years with reference to some selected base year. If index of prices stands at 200 in 2018 compared to 100 in 2004-05 (the base year), it suggests that compared to the base year, prices have risen by 100 per cent.
(2) Quantitative Expression: Index numbers offer a precise measurement of the quantitative change in the concerned variable(s) over time. The index of prices, for example, will tell us that between the years 2017 and 2018, prices have risen by 7 percent, or that industrial production has declined by 3 per cent or that national income has risen just by 3.5 per cent during this period. The index numbers are not the qualitative statements like prices are rising or falling.
(3) Averages: Index numbers show changes in terms of averages. For example, when it is said that between the years 2017 and 2018, prices have risen by 7 per cent, it does not mean that prices of all goods and services have uniformly risen by 7 per cent; it only means that on an average there has been a 7 per cent rise in the prices of various goods and services. Even when prices of certain goods might have risen by more than 7 per cent and of certain others by less than 7 per cent.
3. DIFFICULTIES OR PROBLEMS IN THE CONSTRUCTION OF INDEX NUMBERS
(1) Purpose of Index Number: There are various types of index numbers, constructed with different objectives. Before constructing an index number, one must define the objective. The construction of index number is significantly influenced by the objective or purpose of the study. Thus, for example, if the objective is to study the impact of change in the value of money on the consumers one should construct
consumers’ price index number. If we are to study the impact of change in the purchasing power of money on the producers, we shall construct index number on the basis of wholesale prices. Haberler has rightly pointed out that, ”Different index numbers are constructed to fulfil different objective and before setting to construct a particular index number, one must clearly define one’s object of study because, it is on the objective of the study, that the nature and format of the index number
depends.”
(2) Selection of Base Year: Selection of Base Year is another problem in the construction of index number. Base year is the reference year. It is the year with which prices of the current year are compared. As far as possible, Base Year should be a normal year.
That is, it should be the one without much ups and downs. Otherwise, the index values would fail to capture the real change in the variable. The year 2004-05 is treated as base year in India, at present.
(3) Selection of Goods and Services: Having defined the objective, the problem is of the selection of goods or Services to be included in the index number. To construct the Consumers’ Price Index, for example, all commodities are not included. It is neither possible nor desirable to include all the goods and services produced in the country.
We have to choose those goods and services which represent most of
Purpose of Constructing Index Number of
(i) Prices, and
(ii) Quantities
(i) Purpose of constructing index number of prices is to know the relative change or percentage change in the price level (made up of simple or weighted average of the prices of different goods and services) over time.
A rising general price level over time is a pointer towards inflation, while a falling general price level is a pointer towards deflation. Both inflation as well as deflation have notable consequences for an overall economic activity in the economy.
(ii) Purpose of constructing index number of quantity is to know relative change or percentage change in the quantum or volume of output of different goods and services over time. This reflects the level of economic activity in the economy and its different sectors. A rising index of quantity suggest a rising level of economic activity and vice versa.
others in the market. In other words, commodities selected should be such as are widely consumed, for example, rice, milk, ghee, cloth, etc. Larger the number of goods and services more representative is the index number.
(4) Selection of the Prices of the Goods and Services: Having selected the goods and services, the problem arises of prices to be selected. Broadly, in the construction of Price Index, the problem is whether to adopt retail prices or wholesale prices, controlled or open market prices. The choice would depend upon the objective or purpose of the study.
(5) Finding the Average Prices: In the construction of index number, base year value is assumed to be 100 and other values of different years are related to 100. Thus, if cloth price is Rs. 5 per meter in the base year and is found to be Rs. 10 per meter in the current year, the index of prices of cloth would be 10/5 × 100 = 200 for the current year.
Likewise, price relatives for other commodities are worked out and average for these price relatives is determined and compared with the base year value of 100. It may be noted here that average of base year remains 100, but the average of the year under investigation may be more or less than 100. In case the average of the year under investigation is more than the average of the base year, it means that general price level has gone up. If it is less than the base year, it means that general price level has gone down. Generally, base year is indicated as ‘O’ and current year as T\ Price index is written as P01 and it is read as price index of year 1 in relation year 0.
(6) Selection of Weights: While constructing index number, weights are accorded to different commodities according to their relative significance. There are several methods of according weight, e.g., Fisher’s method, Paasche’s method, Laspeyre’s method. While constructing weighted index number, one must justify his choice of weighting technique in accordance with the nature and objective of his study.
(7) Choice of Average: In finding out average values, different kinds of average may be used, geometric average, arithmetic average, etc. The choice of average significantly influences the results. Different kinds of averages may give different index number of a given change in price.
(8) Selection of Formula: Index numbers can be constructed with the help of many formulae, such as, Laspeyre’s method, Paasche’s method, Dorbish and Rowley’s method, Fisher’s method. One has to decide about the method to be used while constructing the index number.
4. ADVANTAGES OR USES OF INDEX NUMBERS
Some of the main advantages or uses of index numbers are as under.
(1) Measurement of Change in the Price Level or the Value of Money: Most important use of index numbers is that index numbers measure the value of money during different periods of time. We can use index numbers to know the impact of the change in the value of money on different sections of the society. Accordingly, devices or means can be worked out to correct inflationary or deflationary gaps in the system.
(2) Knowledge of the Change in Standard of Living: Index numbers help to ascertain the living standards of people. Money incomes may increase but if index numbers show a decrease in the value of money, living standards may even decline. Thus, index numbers indicate change in real income.
(3) Adjustments in Salaries and Allowances: Cost of living index is a useful guide to the Government and Private Enterprises to make necessary adjustments in salaries and allowances of the workers. Increase in the cost of living index suggests increase in salaries and allowances.
(4) Useful to Business Community: Price index numbers serve as a useful guide to the business community in their planning and decisions. Trend of the prices significantly influence their production decisions.
(5) Information Regarding Production: Index numbers of production shows whether the level of agricultural and industrial production in the economy is increasing or decreasing. Accordingly, agricultural and industrial development policies are formulated.
(6) Information Regarding Foreign Trade: Index of exports and imports provides useful information regarding foreign trade. Accordingly, export-import policies are for multi ted.
(7) Useful to Politicians: Politicians come to know of the real economic condition in the country on the basis of index numbers. They offer constructive criticism of government’s economic policies and give suggestions for economic reforms in the country.
Principal Limitations of Index Numbers These are:
(i) there are no scientific techniques of according weightage to different items included in the index numbers.
(ii) weightage to different items is often influenced by personal bias.
(iii) owing to difference in the unit of currency as well as difference in the composition of production (and consumption) across different countries of the world, it is often very difficult to construct Index Numbers that facilitate international comparisons.
(8) Useful to Government: It is with the help of index numbers that the government determines its monetary and fiscal policies and takes concrete steps for the economic development of the country. In other words, with the help of index numbers government formulates appropriate policies to increase investment, output, income, employment, trade, price level, consumption, etc.
5. LIMITATIONS OF INDEX NUMBERS
In the construction of index numbers, there are some practical difficulties and theoretical limitations. The same are as under:
(1) Not Completely True: Index numbers are not fully true. For example, one can only make an estimate of change in the value of money with the help of index numbers. The index numbers simply indicate arithmetical tendency of the temporal changes in the variable.
(2) International Comparison not Possible: Different countries have different basis of index numbers. These do not help international comparisons.
(3) Difference of Time: With the passage of time, it is difficult to make comparisons of index numbers. With the changing times, man’s habits, tastes, etc., also undergo a change. Consequently, index numbers constructed on the basis of old consumption
pattern cannot be compared with the index numbers constructed on the basis of new consumption pattern.
(4) Limited Use: Index numbers are prepared with certain specific objective. If they are used for another purpose they may lead to wrong conclusions. For example, index numbers prepared to know about the economic condition of the teachers cannot be used to know about the economic condition of the labourers.
(5) Lack of Retail Price Index Numbers: Most of the index numbers are prepared on the basis of wholesale prices. But in real life, retail prices are most relevant, but it is difficult to collect retail prices. Index numbers based on wholesale prices may be misleading. t With regard to the limitations of index numbers, Coulbourn has rightly said, “In this changing world it is difficult to escape from the theoretical defects and in future, as far as we can see, it will not he possible, from theoretical point of view, to make use of the best method, of constructing the index number.”
6. SIMPLE AND WEIGHTED INDEX NUMBERS
‘Simple’ and ‘weighted’ are the two broad categories of index numbers. Here is a brief description of these concepts.
Simple Index Numbers
These are the index numbers in which all items of the series are accorded equal weightage or importance. In case of a simple index of prices, for example, all goods and services are to be accorded equal weightage, no matter whether sale/purchase of certain goods is more than that of the others. It will be a simple average of the prices of different goods and services.
Weighted index Numbers
These are the index numbers in which different items of the series are accorded different weightage, depending upon their relative importance. It is not a simple average of prices
of different goods and services, as in case of a simple price index. Instead, it is to be a weighted average of the prices of different goods. Thus, if the expenditure on rice is twice the expenditure on cloth, then in the construction of price index, price of rice may be accorded ‘2’ as the weight compared to the weightage of T’ to the price of cloth. Though difficult to construct, weighted index numbers certainly offer a much more realistic view of the change over time compared to the simple index numbers.
The basic difference between Simple Index and Weighted Index In the simple index, all items of the series are treated as of equal importance. In the weighted index, weights are accorded to different items depending on their relative importance.
7. METHODS OF CONSTRUCTING INDEX NUMBERS
The following chart shows the various methods of constructing index numbers (Simple as well as weighted):

Let us attempt a brief description of the various methods.
Base Year and its Characteristics
Base year is the year of comparison, also called reference year. It should bear the following characteristics:
(i) It should be a normal year, not showing wide fluctuations in the parameters related to the index number.
(ii) It should be a year for which reliable statistical data are available, so that comparison of the performance of the other years with the base year becomes meaningful-
(iii) It should not be a year too far from the period of study. Otherwise, relative change over time would not make much sense,
(iv) It should be neither very long nor very short period. Generally, it is not more than a year and not less than a month.
CONSTRUCTION OF SIMPLE INDEX NUMBERS
There are two methods of constructing simple index numbers:
(1) Simple Aggregative Method
In this method, aggregate of the prices of commodities in the current year are divided by the aggregate of their prices in the base year and multiplied by 100 to get index value for
the current year. It is expressed by the following formula:
FORMULA
𝑃01 = Σ𝑃1/Σ𝑃0 × 100
ΣPo
Here, P01 = Price index of the current year.
ΣPL = Sum of the prices of the commodities in the current year.
ΣP0 = Sum of the prices of the commodities in the base year.
Current Year: Current year is the year for which average change is to be measured or index number is to be calculated.
Base Year: Base year is the year of reference from which we want to measure extent of change in the current year. The index number of base year is generally assumed to be 100.
Illustration.
Given the following data and assuming 2004 as the base year, find out index value of the prices of different commodities for the year 2018.

Solution:
Construction of a Simple Index Number— Simple Aggregative Method
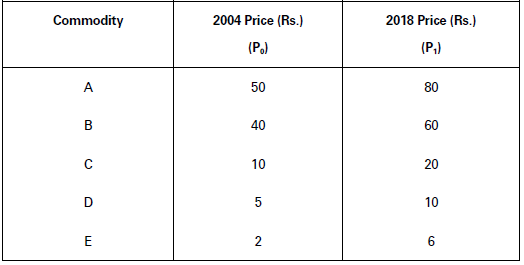

P01 = 𝛴P1/𝛴P0 × 100
= 176/107 × 100
= 164.49
Price Index = 164.49.
(2) Simple Average of Price Relatives Method
According to this method, we first find out price relatives for each commodity and then take simple average of all the price relatives.
What is Price Relative?
A price relative is the percentage ratio of the value of a variable in the current year to its value in the base year. In other words, a price relatives is a percentage ratio between
price of a commodity in the current year and that in the base year.
Price Relatives, P01 = Current Year Price (P1) / Base Year Price (P0) × 100
We can find out price index number of the current year by using the following formula.
FORMULA
𝑃01 = 𝛴(𝑃1/𝑃0 × 100)/𝑁
An Important Caution
Prices for different commodities are expressed with reference to different units of measurement. Price of steel, for example, is expressed as rupee per kg, while the price of milk is expressed as rupee per liter, and the price of doth is expressed as rupee per meter. Simple aggregate method of index numbers cannot be used for commodities with different units of measurement. It can be used only for those commodities which have a common unit of measurement.
(Here,
𝑃1/𝑃0 × 100× 100 = Price relatives; N = Number of goods; P, = Current year’s value; P0 = Base year’s value.)
Illustration.
Given the following data and using the Price Relatives Method, construct an index number for the year 2018 in relation to 2004 prices.


Notation of 0 and 1
Often the notation of 0 stands for the base year, and 1 stands for the current year.
Solution:
Construction of a Simple Index Number— Simple Average of Price Relative Method
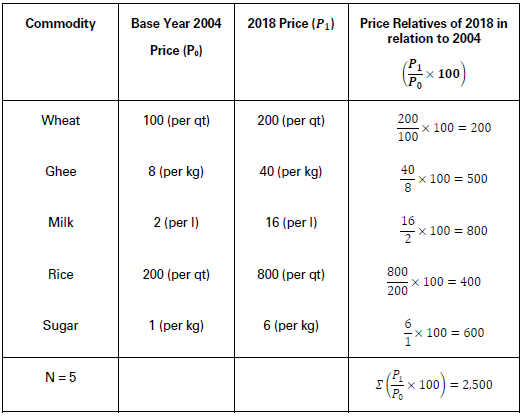
P01 = 𝛴(P1/P0 × 100)/N = 2,500/5 = 500
Price Index = 500.
CONSTRUCTION OF WEIGHTED INDEX NUMBERS
There are two methods of constructing weighted index numbers, as discussed below:
(1) Weighted Average of Price Relatives Method
Not all Commodities are Ever Included
Not all commodities are ever included in the construction of an Index Number. Only a sample of commodities is taken which represents characteristics of the entire group of commodities under study.
According to this method, weighted sum of the price relatives is divided by the sum total of the weights. In this method, goods are given weight according to their quantity. Thus,
FORMULA
𝑃01 = Σ𝑅𝑊/Σ𝑊
(Here, P01 = Index number for the current year in relation to the base year; W = Weight;
R = Price relative.)
Illustration.
Given the following data and using Weighted Average Price Relative Method, construct index number for 2018 based on 2004 prices.
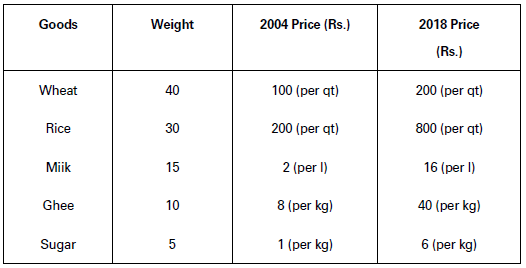

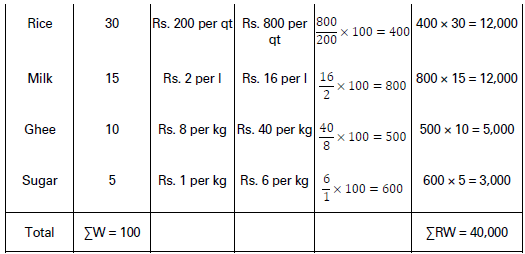
𝑃01 = 𝛴𝑅𝑊/𝛴𝑊
= 40,000/100
= 400
Price Index = 400.
(2) Weighted Aggregative Method
Under this method different goods are accorded weight according to the quantity bought. Economists have different views in this respect. Should the weight be given (i) on the basis of the quantity bought in the current year or (ii) on the basis of the quantity bought in the base year or (iii) on the basis of the quantities bought in both the years?
Different economists have, therefore, suggested different techniques of weighting. Some of the well-known methods are as under:
What is the basic difference between Laspeyre’s and Paasche’s methods of construction of Weighted index Numbers?
Laspeyre’s uses base year quantities as the weights of different items. Paasche’s on the other hand, uses current year quantities as weights.
(i) Laspeyre’s Method: Laspeyre’s uses base year quantities (q0) as weights of different items. His formula for estimating Index values is:
FORMULA
𝑃01 = Σ𝑝1𝑞0/Σ𝑝0𝑞0 × 100
(ii) Paasche’s Method: Paasche’s on the other hand uses current year’s quantities (qt) as weight. His formula to construct the Index value is:
FORMULA
𝑃01 = Σp1q1/Σp0q1 × 100
(iii) Fisher’s Method: Fisher has combined the techniques of Laspeyre’s and Paasche’s method. He used both base year as well as current year quantities (q0, q,) as weight.
His formula to construct Index Number is:
FORMULA
𝑃01 = √ (ΣP1Q0/ΣP0Q0) × √(ΣP1Q1/ΣP0Q1 × 100)
Fisher’s method is treated as Ideal Formula.
FISHER’S INDEX NUMBER AS AN IDEAL METHOD
The choice of method for the construction of an index number will depend upon the object with which a particular index number is constructed. Many formulae may be used for the construction of index numbers but all may not be suitable for the specific purpose in hand. Some of the important formulae do not conform to certain appropriate test of consistent behaviour; it implies that these formulae give us biased results.
However, Fisher’s Method is considered as an ideal method for constructing index numbers:
𝑃01 = √ Σ𝑃1𝑞0/Σ𝑃0𝑞0 × Σ𝑝1𝑞1/Σ𝑝0𝑞1 × 100
Fisher’s method is considered as idea because
(i) It is based on variable weights.
(ii) It takes into consideration the price and quantities of both the base year and current year.
(iii) It is based on geometric mean (GM) which is regarded as the best mean for calculating index number.
(iv) Fisher’s index number satisfies both the Time Reversal Test and Factor Reversal Test.
The time reversal test implies that the formula for calculating an Index Number should be such that will give the same ratio between one point of comparison and the other, no matter which of the two is taken as base. Time Reversal means that if we change base year to current year and vice versa then the product of two indexes should be equal to unity. Thus, an index number should work both ways, i.e., forward as well as backward. On the other hand, Factor Reversal Test implies, just as our formula should permit the interchange of two items without giving inconsistent results, so it ought to permit interchange of prices and quantities without giving inconsistent results, i.e., the two results multiplied together should be equal to value ratio.
Illustration.
Construct index numbers of prices of the items in the year 2018 from the following data by:
(i) Laspeyre’s Method,
(ii) Paasche’s Method, and
(iii) Fisher’s Method.
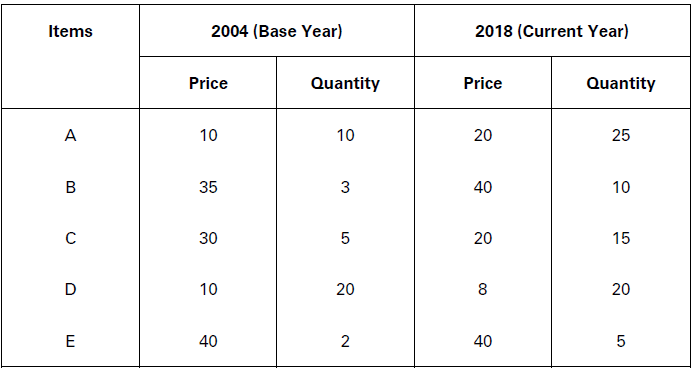
Solution:
Construction of Price Index Numbers


(i) Laspeyre’s Method: 𝑃01 = 𝛴p1q0/𝛴p0q0 × 100
= 660/635 × 100 = 103.94
(ii) Paasche’s Method: 𝑃01 = Σp1q1/Σp0q1 × 100
= 1,560/1,450 × 100 = 107.59
(iii, Fisher’s Method: 𝑃01 = √Σp1q0/Σp0q0 × Σp1q1/Σp0q1 × 100
= √660/635 × 1,560/1,450 × 100
= √1.03 × 1.07 × 100
= √1.1021 × 100
= 1.05 × 100 = 105
Illustration.
Find out index value from the following data using (i) Laspeyre’s Method, (ii) Paasche’s Method, and (iii) Fisher’s Method.
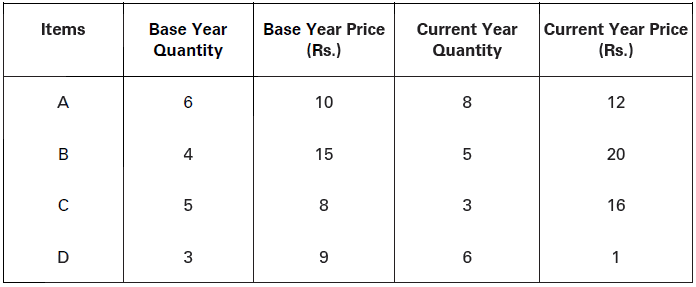
Solution:


(i) Laspeyre’s Method: 𝑃01 = Σ𝑝1𝑞0/Σ𝑝0𝑞0 × 100
= 235/187 × 100 = 125.67
(ii) Paasche’s Method: 𝑃01 = Σp1q1/ΣP0q1 × 100
= 250/233 × 100 = 107.29
(iii) Fisher’s Method, 𝑃01 = √Σ𝑝1𝑞0/Σ𝑝0𝑞0 × Σ𝑝1𝑞1/Σ𝑝0𝑞1 × 100
= √ {235/187 × 250/233 × 100}
= √1.2567 × 1.0729 × 100}
= √(1.3483 × 100)
= 1.1612 x 100 = 116.12
Illustration.
From the following data construct Fisher’s Ideal Index:


P01 = √ Σp1q0/Σp0q0 × Σp1q1/Σp0q1 × 100
= √758/544 × 782/561 × 100
= √1.9423 × 100
= 139.37
8. CONSUMER PRICE INDEX OR COST OF LIVING INDEX NUMBER
So far we have been focusing on general price indices. But these indices do not precisely explain how the change in general price level affects the cost of living of rife various classes of society. This is because different classes of people consume different goods and services. Accordingly, the change in prices affect them differently. To know the effects of changing prices on the living of different classes of society, we need a special type of price index, called Consumer Price Index or Cost of Living Index Number.
The consumer price index is the index number which measures the average change in prices paid by the specific class of consumers for goods and services consumed by them in the current year in comparison with base year. Change in the price level affects the cost of living of the concerned class of consumers. Accordingly, consumer price indices are also called cost of living indices.
In India, the consumer price indices are mainly constructed for the following consumer groups:
(i) Industrial Workers (IW)
(ii) Urban-Non-Manual Employees (UNME)
(iii) Agricultural Labourers (AL).
Construction of Consumer Price index
Construction of the consumer price index number involves the following steps:
(1) Selection of the Consumer Class: Consumers are classified into various classes like industrial labour, government employees, agricultural labour, teachers, etc. We should select the class of consumer according to the requirement of our study.
(2) Information about the Family Budget: After the decision about the group, a sample of persons should be selected from the group and following information about their family budgets should be obtained:
(i) Commodities which they consume.
(ii) Quantity of consumption.
(iii) Prices of the concerned goods and services.
(iv) Money spent on these goods and services.
The items which are generally consumed may be classified in groups like (i) Food, (ii) Clothing, (iii) Fuel and light,
(iv) House rent, (v) Education, health and sanitation, (vi) Miscellaneous.
(3) Choice of Base Year: The base year should be the ^ear of economic stability. It should not be too distant from the current year. Presently, 2011-12 is being used as base year.
(4) Information about Prices: The retail prices of selected items/ commodities should be collected from the region where the group of selected person lives and makes the
purchases.
(5) Weightage: The importance of various items for different classes of people is different. Therefore, the selected items should be given weights according to their relative importance. As discussed earlier, there are two ways of according weights:
(i) Quantity Weights: These weights are given in proportion to the quantities consumed in the base period.
(ii) Expenditure Weights: These weights are given in proportion to the total expenditure on the items consumed in the base period.
Methods of Constructing Consumer Price index (CPI)
Corresponding to the two methods of assigning weights to different commodities, there are two methods of the construction of Consumer’s Price Index.
(1) Aggregative Expenditure Method
(2) Family Budget Method.
(1) Aggregative Expenditure Method: This method is similar to
the Laspeyre’s method (already discussed).
The following formula is used in this method.
FORMULA
Consumer Price Index (CPI) = 𝛴𝑝1𝑞0/𝛴𝑝0𝑞0 × 100
where, p1 = Price of the commodities in the current year.
p0 = Price of the commodities in the base year.
Thus,
q0 = Quantity consumed in base year.
Σp1q0 shows aggregate expenditure in the current year.
Σp0q0 shows aggregate expenditure in the base year.
P01 = Σp1q0/𝛴P0q0 × 100
(2) Family Budget Method: The following formula is used in this method to find Consumer’s Price Index.
FORMULA
Consumer’s Price Index = 𝛴RW/𝛴W .
where, R = Current year’s price relative of various items. W = Weights of various items.
Calculation of CPI by this method involves the following steps:
(i) The current year’s price (pj) of each commodity is divided by the base year’s price (p0) of the respective commodities. Then the resultant is multiplied by 100. These are called price relatives of the current year.
Therefore,
Price Relatives of the Current year
Price of the Current Year
Price of the Base Year × 100
R = P1/P0 × 100
(ii) Aggregate expenditure on each item is considered as the weight of the item. Hence, the weight (W) of a commodity is calculated by multiplying the price (p) of a commodity in the base year with the quantity (q0) of the commodity consumed in the base year.
(iii) The price relative (R) of each item is multiplied with their respective weights (W = p0q0)- These products are added to find ΣRW.
(iv) The sum of weights ΣW or Σp0q0 is calculated.
(v) These values are substituted in the following formula to find the consumer’s price index.
Consumer Price Index
Sum of Products of the Price relative with weights
Sum of Weights
Thus:
𝑃01 = Σ𝑅𝑊/Σ𝑊
Illustration.
Find the Consumer Price Index or the Cost of Living Index Number for the current year from the following data by (i) Aggregate Expenditure Method, and (ii) Family Budget Method.

Solution:
(i) Aggregative Expenditure Method
From the given data we derive the following table:
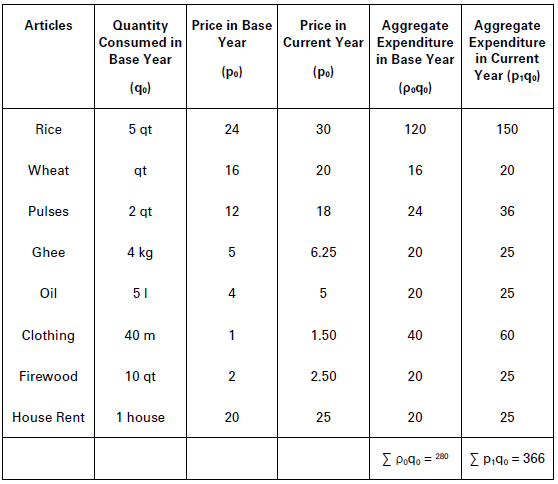
Index Number for Current Year = Σp1q0/ΣP0q0 × 100
= 366/280 × 100 = 130.71
(ii) Family Budget Method

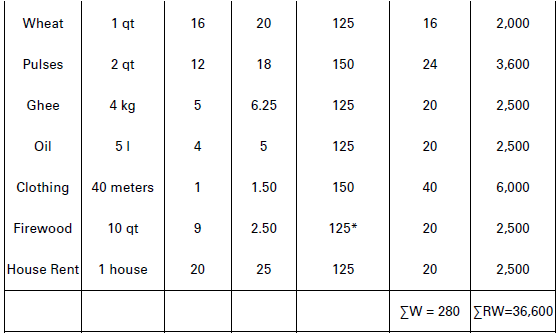
Now CPI for Current Year = 𝛴RW/𝛴W = 36,600
280 = 130.71
Illustration.
Calculate the Cost of Living Index from the following data:

Solution:

Cost of Living Index = Σp1q1/Σp0q1 × 100
= 2,084.4/824.4 × 100 = 252.84
Illustration.
Construct Cost of Living Index for 2018 based on 2004 from the following data:


Thus, Cost of Living Index = ΣRW/𝛴W = 11,572
100 = 115.72
Uses
(i) Formulation of Price Policy.
(ii) Wage Adjustment.
(iii) Measurement of Real Value.
(iv) Analysis of Markets.
(v) National Income Deflator.
Importance of the Consumer Price Index or Cost of Living Index
(1) Formulation of Price Policy: The consumer price indices are used by government to frame policies on prices. On the basis of these indices government decides whether the prices are to be controlled, dual price policy should be adopted or public distribution system is to be introduced, etc. Also, government policies like rent control and taxation, general economic and fiscal policies etc. are framed on the basis of the consumer price index numbers to a large extent.
(2) Wage Adjustment: Cost of living index numbers are used as basis for the wage adjustments. The rates of dearness allowances are decided by the government on the basis of these indices. These indices are also used for wage contracts and wage agreements of the workers.
(3) Measurement of Real Value: These index numbers are used to measure the real value
of the rupee or its purchasing power and real income (or revenue), etc.
(4) Analysis of Markets: The consumer price indices are also used for the analysis of the market of specific commodities for their demand and supply.
(5) National Income Deflator: These indices are also used as deflators of national income. Accordingly, real change in national income is estimated.
Difficulties in the Construction of Consumer Price Index
There are many difficulties in the construction of consumer price index. These are as follows:
(1) Difference in the Standards of Living: Consumption pattern of different classes of consumers are different and therefore, have different living standards. Thus, there cannot be one consumer price index number for different classes of society.
(2) Difference in Prices: The price indices are constructed on the basis of retail prices. But the retail prices vary from place to place and even at the same place from shop to shop. As such it is very difficult to find a representative price for the calculation of consumer price index.
(3) Difference in the Proportion of Expenditure: All the members of any particular group do not spend on various items of consumption in same ratio and even one person does not spend on various commodities in the same ratio at two different periods of time. A consumer’s purchase ratio depends upon his/her taste, habits, etc. Accordingly, it is difficult to construct a cost of living index that truly reflects a change in the cost of living over time.
9. WHOLESALE PRICE INDEX (WPI)
The Wholesale Price Index (WPI) measures the relative changes in the prices of commodities traded in the wholesale markets. In India, the wholesale price index numbers are constructed on weekly basis. The year 2011-12 is being used as the base year.
Commodity Group and Weightage of Wholesale Price Index
In India, all the commodities have been classified in the following three groups:

The basic difference of purpose behind the Consumer Price Index Number and the Wholesale Price Index Number
In case of consumer price index number, the basic purpose is to know cost of living of a specified group of consumers in the society. In case of wholesale index number, the basic purpose is to assess the situations of overall demand and supply in the economy.
Rising prices indicate a situation of excess demand, while falling prices suggest a situation of deficient demand. Wholesale price index focuses on the rate of inflation in the economy.
Producer Price Index As in many countries, in India also, efforts are afoot to shift from WPI (Wholesale Price Index) to Producer Price Index. Producer-Price refers to the basic price
including taxes, trade margins and transport cost. Producer Price Index is expected to offer better insights into the analysis of price trends in the country.
Uses of Wholesale Price Index
(1) Forecasting Demand and Supply: The wholesale price indices are often used to forecast demand and supply situation in the economy. An increase in wholesale price index is an indication of excess demand. It is a situation in which demand is greater than supply. On the other hand, a decrease in wholesale price index implies deficient demand. It is a situation in which demand is less than supply.
(2) Estimation of Monetary Value and Real Value: The wholesale price index can be used to estimate the monetary value and real value of aggregates like national income and expenditure. Monetary value is the value estimated at current year prices. Real value is the value estimated at base year prices or at constant prices. The monetary aggregate can be
converted into real aggregate by applying the following formula:
Real Aggregate of the Current Year = Monetary Aggregate of the Current Year
Price Index of Base Year/Price Index of Current Year
(3) Indicator of Rate of Inflation: The wholesale price index is also applied to calculate the rate of inflation in a country. It refers to the rate at which prices tend to increase over time.
What is Rate of Inflation?
Wholesale price index is prepared for every week. If for week 1, wholesale price index is A, and for week 2, the wholesale price index is A2, then the rate of inflation between week
1 and week 2 would be estimated as under;
𝐴2 − 𝐴1/𝐴1 × 100
Illustration.
If wholesale price index for week 1 = 200 and for week 2 = 250, then
Rate of inflation = 250−200/200 × 100 = 50/1200 × 100 = 25%
Annual rate of inflation is estimated by considering average of the wholesale price index for all weeks of the year.
10. INDEX NUMBER OF INDUSTRIAL PRODUCTION
Index number of industrial production is that index which measures the relative increase or decrease in the level of industrial output in a country in comparison to the level of
roduction in the base year. In India, the base year for the current series is 2011-12. These index numbers tell us about the changes in the quantum of production. These index numbers are useful in estimating the growth of industrial production in the economy.
Construction of Index Number of Industrial Production
Construction of the index number of industrial production involves the following steps:
(1) Classification of Industries: To construct index number of industrial production the industries are classified into following groups:
(i) Mining, (ii) Manufacturing, and (iii) Electricity.
(2) Statistics or Data Related to Industrial Production: The data relating to the production of the above-mentioned industries are collected either monthly, quarterly or yearly.
(3) Weightage: Weights are given on the basis of the relative importance of different industries. The weights are based on the values of net output of different industries, and their contribution to national income.
In India, the following weightage is given to different groups at present:

Index Number of Industrial Production is calculated by using the following formula:
FORMULA
Index Number of Industrial Production =
𝛴(𝑞1/𝑞0)𝑊/Σ𝑊 × 100
where, q1 = Level of production in the current year.
Q2 = Level of production in the base year.
W = Weight or relative importance of industrial output.
Illustration.
Construct index number of industrial production from the following data:
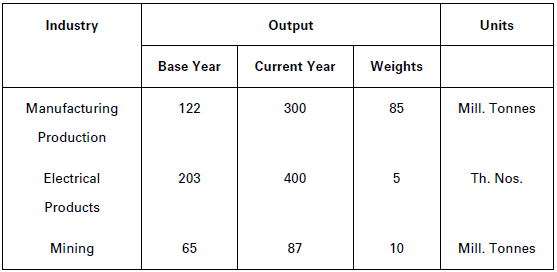
Solution:
From the given data we have

Index Number of Industrial Production
= ΣRW/ΣW
= 23,226.50/100
= 232.27(approx. )
11. INFLATION AND INDEX NUMBERS
Inflation refers to a situation of rise in the general price level in a country over a long period of time. Often, inflation is measured in terms of wholesale price index. A consistent rise in the wholesale price index over time implies a situation of inflation. Example: If wholesale price index rises from 100 in 2011-12 (base year) to 150 in 2018, and if the increase in price has almost been consistent over time (like, every year the general price level has been rising by 5-10%), it would be deemed as a situation of inflation. Implying a continuous erosion in the value of money or purchasing power of money. Value of money (or purchasing power of money) reduces to half if wholesale price index rises by 100%. Obviously, double the price level, half the purchasing power of a rupee. If money income of the people remains constant, 10% increase in the price level implies a 10% decrease in purchasing power of the people.
Inflation causes erosion of purchasing power of the people, if their money income remains constant. Accordingly, often we find workers pestering the government for dearness allowance (DA) to compensate for the loss of purchasing power during periods of inflation.
Fall in the Rate of Inflation does not Imply Fall in the Price Level
Students here must appreciate the distinction between inflation and the rate of inflation. Inflation is measured as a percentage increase in the general price level, like from 100 in 2017 to 115 in 2018, implying a 15% increase in the price level during the period of one year. While prices have tended to increase during the year, these may not be rising at the same pace (or the same rate) every week within the year. Relative change in the price index from week to week measures the rate of inflation.
Rate of Inflation = A2−A1/A1 × 100
where, Aj = Wholesale price index for week 1, and Ag = Wholesale price index for week 2. Thus, within the year, rate of inflation may increase or decrease. It only implies the increase or decrease in the pace of inflation or increase/decrease in the speed of inflation not a fall in the price level. To illustrate, in week 1 the rate of inflation may be 5% while in week 2, the rate of inflation may be 4%. Fall from 5% to 4% should not be interpreted as a fall in the price level. It only implies a fall in the speed at which prices tend to rise.
Inflation is measured in terms of changes in the wholesale price index, based on weekly quotations of wholesale prices.
increase in the wholesale price index over a long period of time implies a situation of inflation. It causes erosion of purchasing power of money.
In a situation of inflation, trade unions often pester for higher money wages to compensate for the fall in the purchasing power of a rupee.
Sensex
Sensex is the index showing changes in the Indian stock market It is a shirt form of Bombay Stock Exchange Sensitive Index. It is constructed with 1978-79 σs the reference year or the base year. It consists of 30 stocks of the leading companies in the country. Changes in these stocks are expected to represent changes in the entire stock market. Rise in sensex implies an overall increase in share prices. This shows increase in expected earnings from investments in the stock market. This also implies robust performance of the principal industries in the economy.